Multiple on-chain data indicators show weak market sentiment; we experienced a second round of capitulation last week
Since the sell-off in mid-May, Bitcoin has continued to fluctuate within a low range. In early last week, Bitcoin briefly broke below $29,000, but bulls subsequently fought back, and the weekly candle finally closed above $33,000. The volatility over multiple days indicates that investors still hold seriously divided views on the market. Plan B, a well-known analyst within the community who created the BTC-S2F model, stated that Bitcoin prices will reach $135,000 by the end of 2021. Previously, Mike McGlone, Senior Commodity Strategy Analyst at Bloomberg BI, also pointed out that Bitcoin's next stop is $100,000, not below $20,000. Publicly traded company Micro Strategy put this into practice by purchasing 13,005 Bitcoin for a total price of $489 million. However, at the same time, Bitcoin mining difficulty is about to see four consecutive downward adjustments, the first time since the 2018 bear market. The MA120 and MA200 referenced by technical analysts have both been lost and failed to reclaim. Additionally, institutions have begun to slow their entry, so not everyone believes the market has truly bottomed, with further downside risk remaining.
As the second-largest crypto asset—Ethereum—is about to undergo the London hard fork, the EIP-1559 upgrade may lead to Ethereum supply contraction. For example, since the Ethereum testnet Ropsten activated the London upgrade on June 24, approximately 88,931.57 ETH have been burned to date, worth over $190 million.
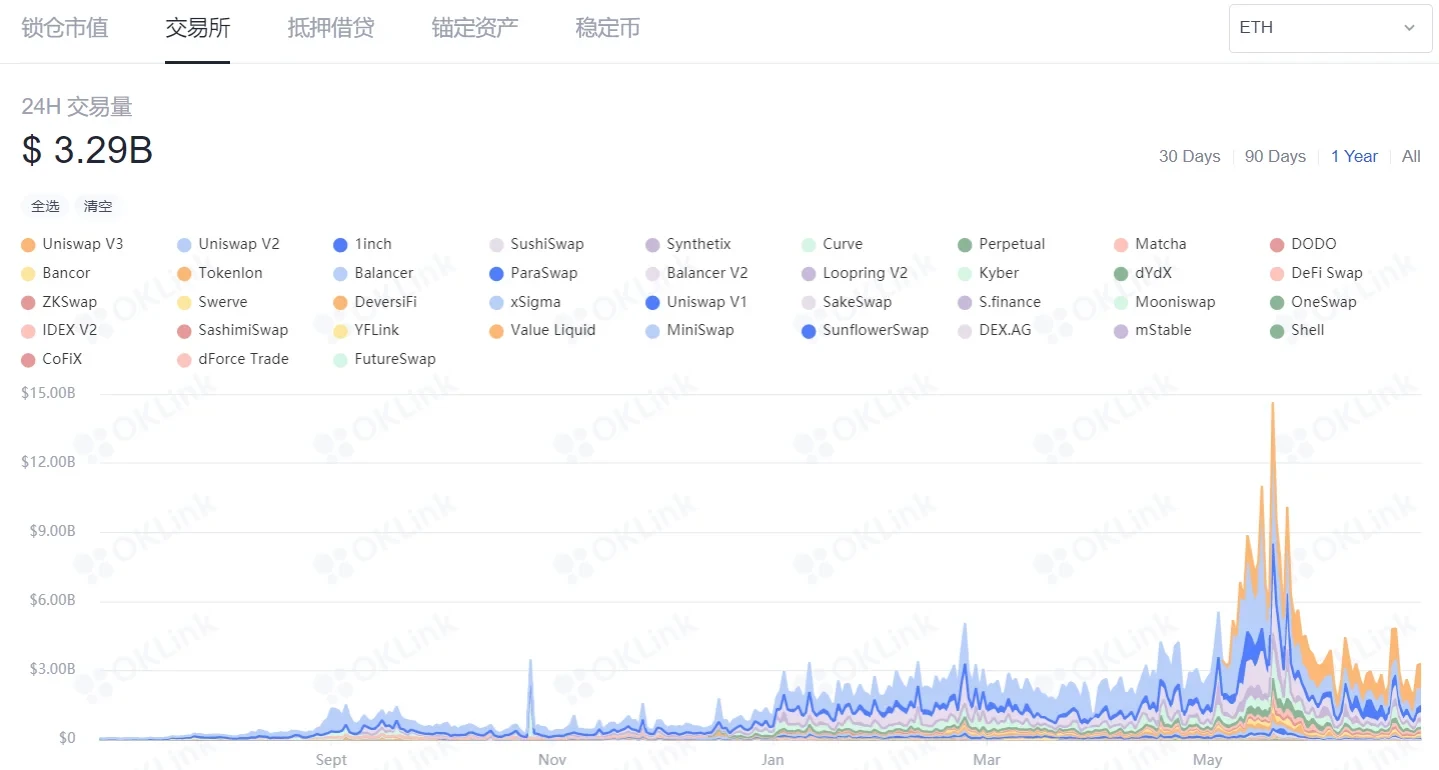
In early last week, due to Bitcoin's decline, Ethereum also briefly fell to $1,700 but has now reclaimed $2,000. Recently, overall market performance has been lackluster, and Ethereum's on-chain activity has declined. DEX trading volume has dropped 77.5% from its highs. Additionally, due to the market being flooded with large amounts of stablecoins, DeFi risk-free returns have also seen serious declines. Nevertheless, some analysts still believe that as the most commonly used blockchain, Ethereum's value is seriously undervalued. However, for now, the ETH/BTC exchange rate has returned to 0.061, and its price action remains difficult to "decouple" from Bitcoin.
Market experienced a second round of capitulation; institutional demand slowing
Early this morning, Glassnode released last week's on-chain weekly report. The report shows that since the mid-May decline created a record $2.65 billion in maximum realized net losses, surpassing the previous high of $1.38 billion in sell-offs during the March 2020 liquidity crisis, we saw market capitulation again last week, creating a new historical record of $3.45 billion in realized losses.
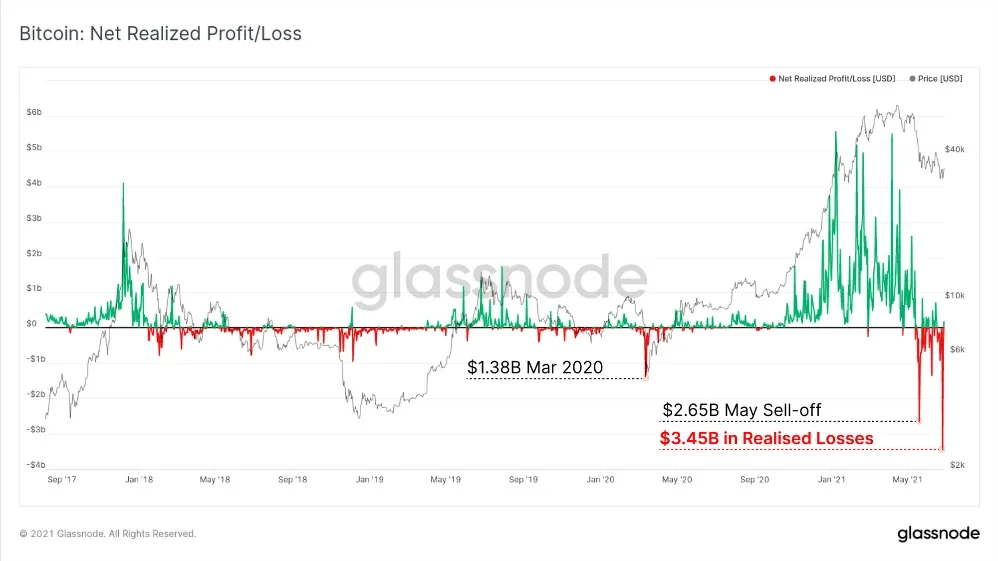
In fact, last week's total losses were $3.83 billion. Since long-term holders are basically profitable, the profits from their sales offset $383 million in losses, resulting in a recorded net loss of $3.45 billion.
To make it more intuitive, we can look at SOPR (Spend Output Profit Ratio, the ratio of selling price to buying price). The chart below left shows long-term holder SOPR, and below right shows short-term holder SOPR.
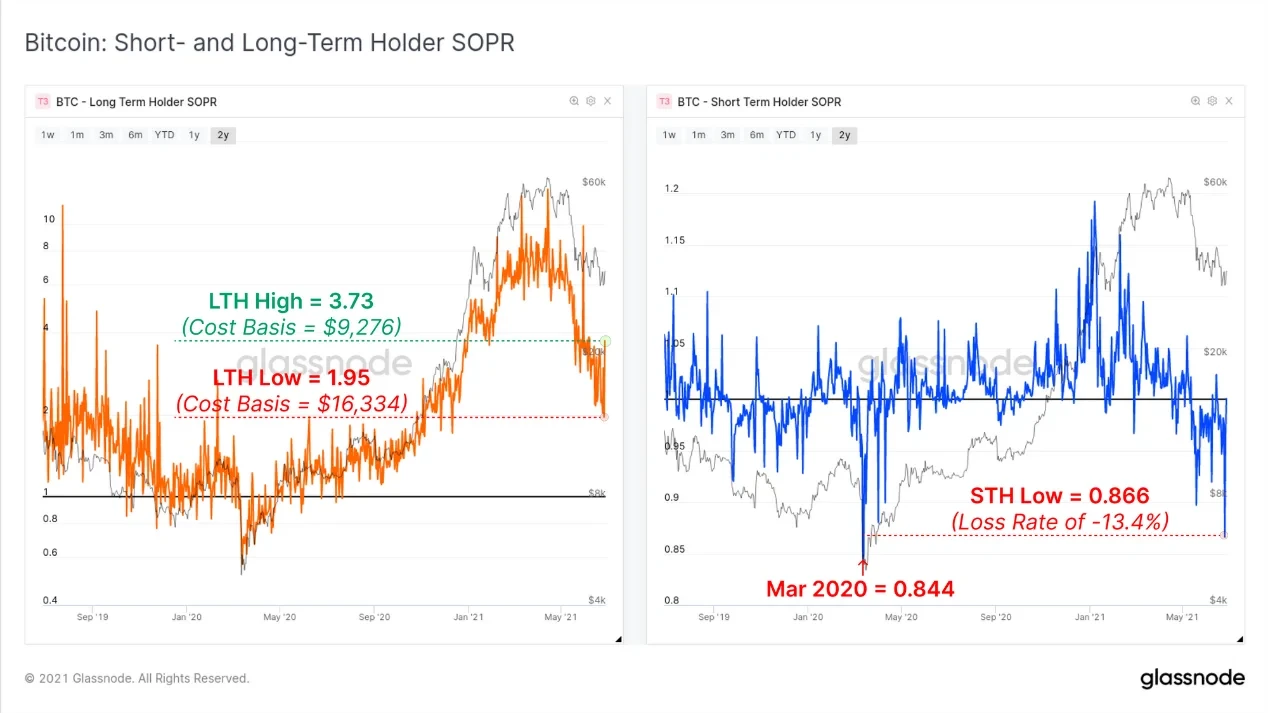
Last week, long-term holder SOPR values ranged from a high of 3.73 to a low of 1.95, meaning some long-term holders with cost bases between $9,276 and $16,334 began selling Bitcoin to realize profits, while short-term holder SOPR values have already fallen below 1. Last week's second round of capitulation means this group realized significant losses again, slightly lower than March 2020. Last week's price decline appears to have caused panic among both short-term and long-term holders.
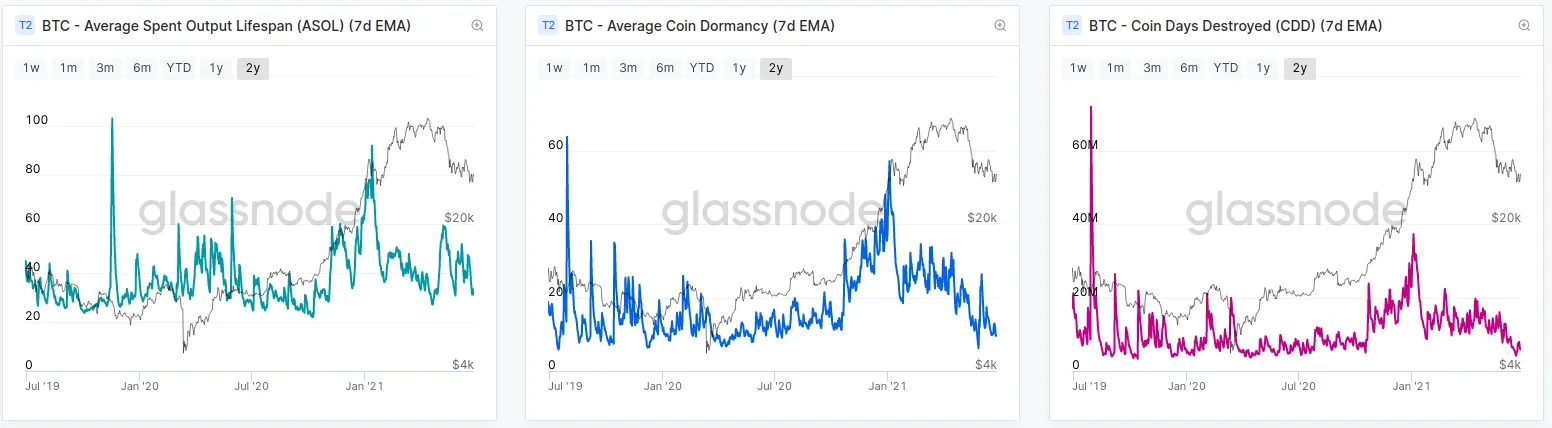
Because Glassnode's classification method defines those holding for more than 155 days as long-term holders, but this remains a relatively broad concept, we further observe ASOL (Average Spent Output Lifespan), average coin dormancy, and coin days destroyed to determine whether long-term holder confidence is beginning to waver.
If ASOL (Average Spent Output Lifespan metric) values are high, it means Bitcoin held for longer periods is being moved and spent, while low values indicate Bitcoin held for longer periods remains in storage and dormancy.
Average Coin Dormancy is the average number of days destroyed for each Bitcoin traded, defined as the ratio of destroyed days to total transferred volume. The higher its value, the more it indicates long-term holders are moving and spending Bitcoin.
Coin Days Destroyed (CDD) is also an indicator measuring long-term holders. For any trade, the coin days destroyed equals the quantity of coins moved in that transaction multiplied by the number of days those coins remained unmoved. Therefore, the longer-held coins are transferred, the higher the coin days destroyed value.
Thus, the higher these three metrics are, the more it indicates long-term holders are moving their tokens. From the three charts below, we can see that most long-term holders have not spent their Bitcoin. Although the market has realized $3.45 billion in net losses, the average age of moved tokens remains quite young. The sellers flooding the market are primarily short-term holders, with 23.5% of circulating Bitcoin held by short-term holders in unrealized losses, and only 3.4% in profit.
Due to hashrate migration phenomena, the market has been speculating on the magnitude of miner selling pressure. There are two reasons for miner selling: first, after the coin price dropped nearly 50%, miners need to sell more Bitcoin to cover the same fiat costs; second, logistics costs and risk management costs for relocation.
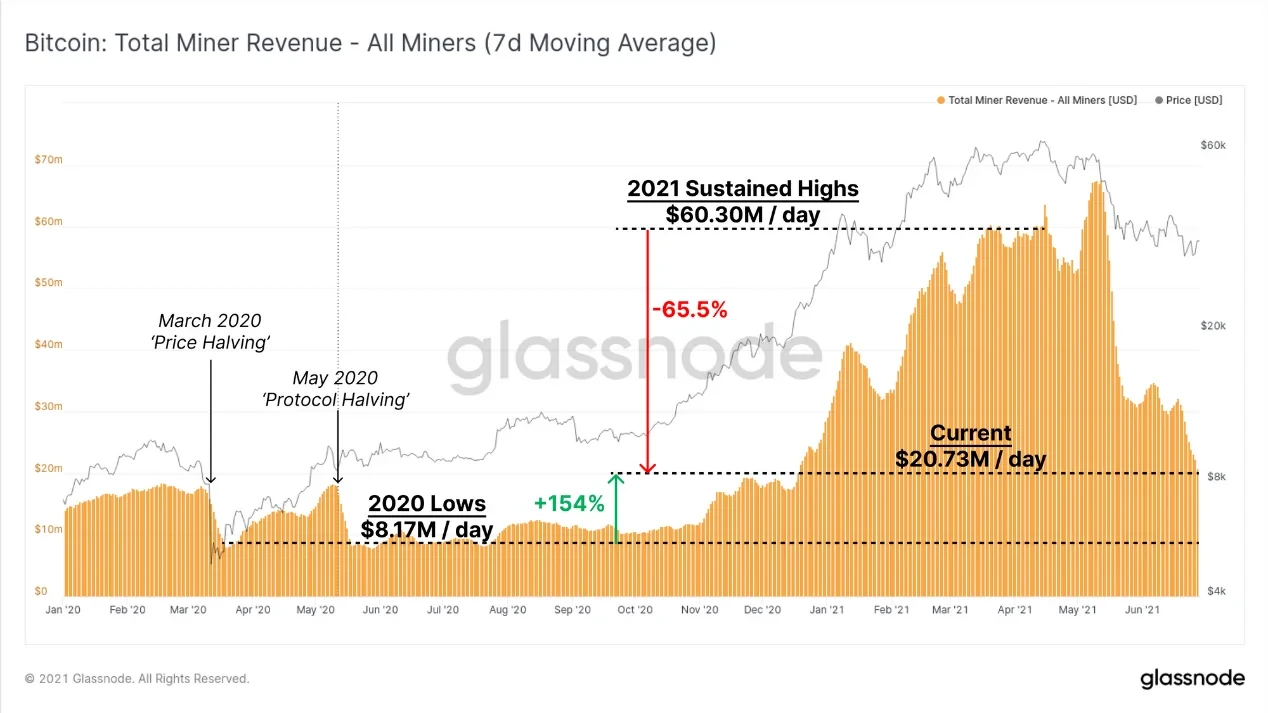
According to the Miner Total Income (7DMA) chart, compared to the 7-day average income peak of $60.3 million/day in March and April, current miner 7-day average income is $20.73 million/day, a decline of approximately 65.6%, but still 153.7% higher than the $8.17 million/day income in 2020 after experiencing consecutive "price halving" and "reward halving."
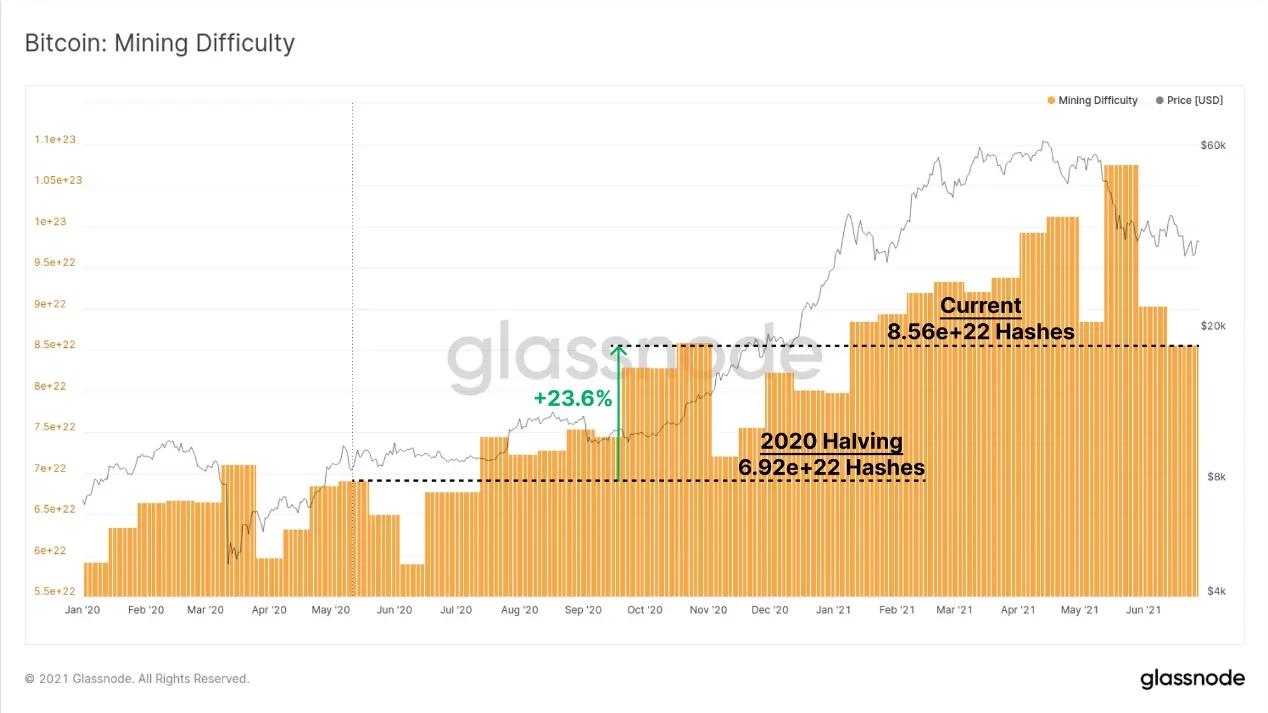
Meanwhile, mining difficulty only increased by 23.6%, meaning 2021 Bitcoin mining profits have been relatively attractive, and some outdated mining rigs can restart due to reduced difficulty and continue profitable operations. OK Link data shows the next difficulty adjustment is expected to decrease by 24.15% to 15.12T, which will also be the fourth consecutive difficulty decline since the 2018 bear market. Clearly, continuing miners will achieve higher profits in the coming weeks. This also largely indicates that operating miners are unlikely to be forced to sell Bitcoin.
Looking at miner wallet balances, since the low of 1.8 million Bitcoin on January 27, miners have accumulated 10,000 Bitcoin over 5 months, accounting for 7.6% of Bitcoin mined in the past nearly 5 months, meaning 92.4% of tokens flowed to the secondary market.
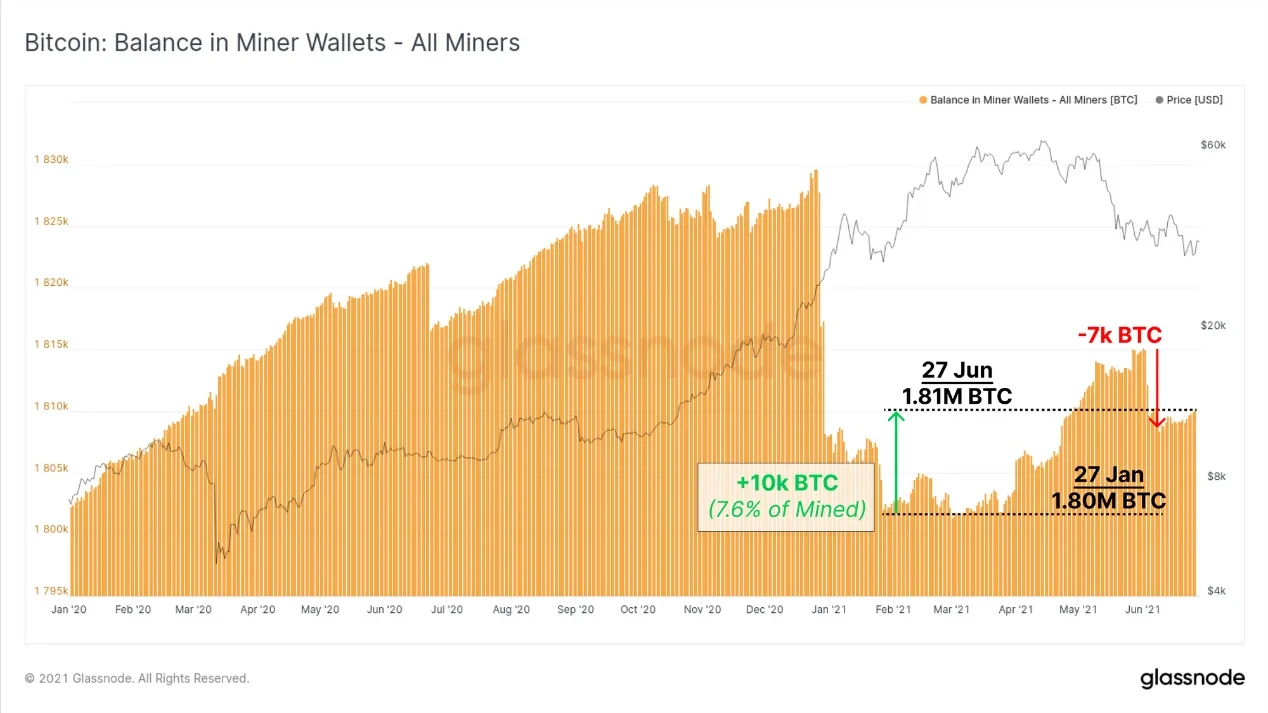
Recently, the amount of Bitcoin flowing from miners to exchanges has been significantly lower than in Q1 2020 and 2021. At that time, miner flows to exchanges were approximately 300-500 Bitcoin/day, while now it has steadily declined to below 200 Bitcoin/day.
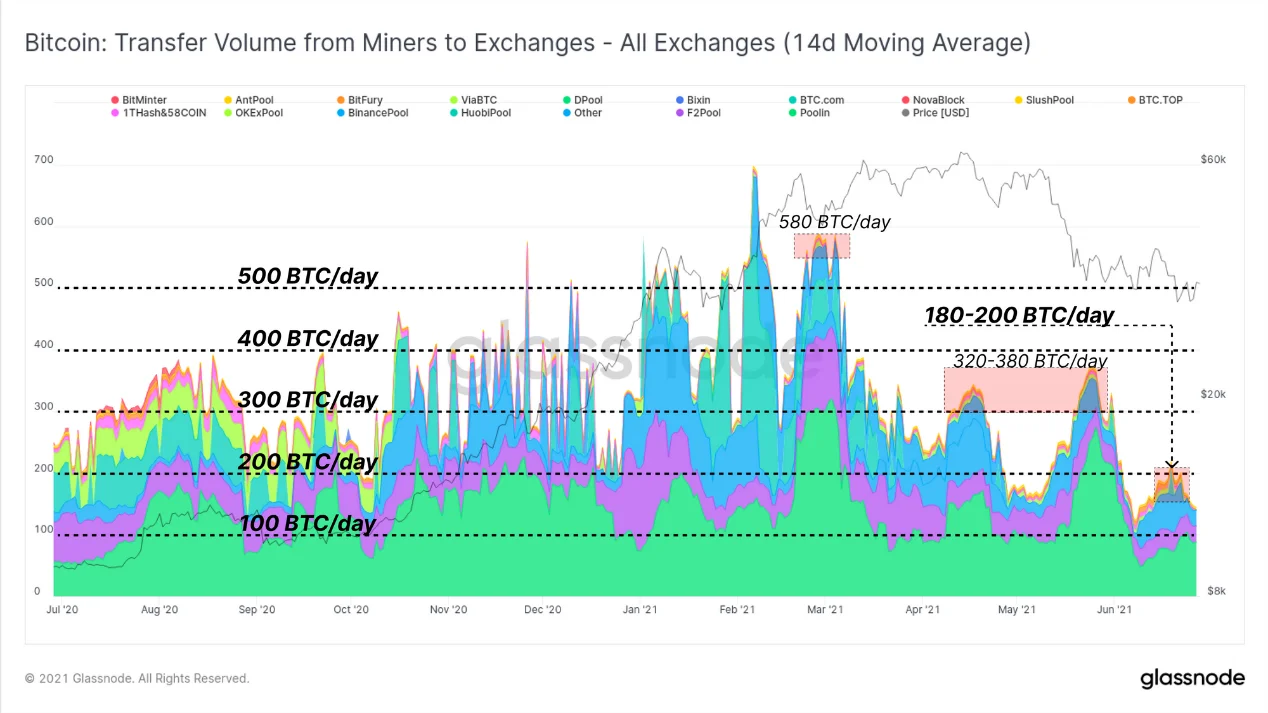
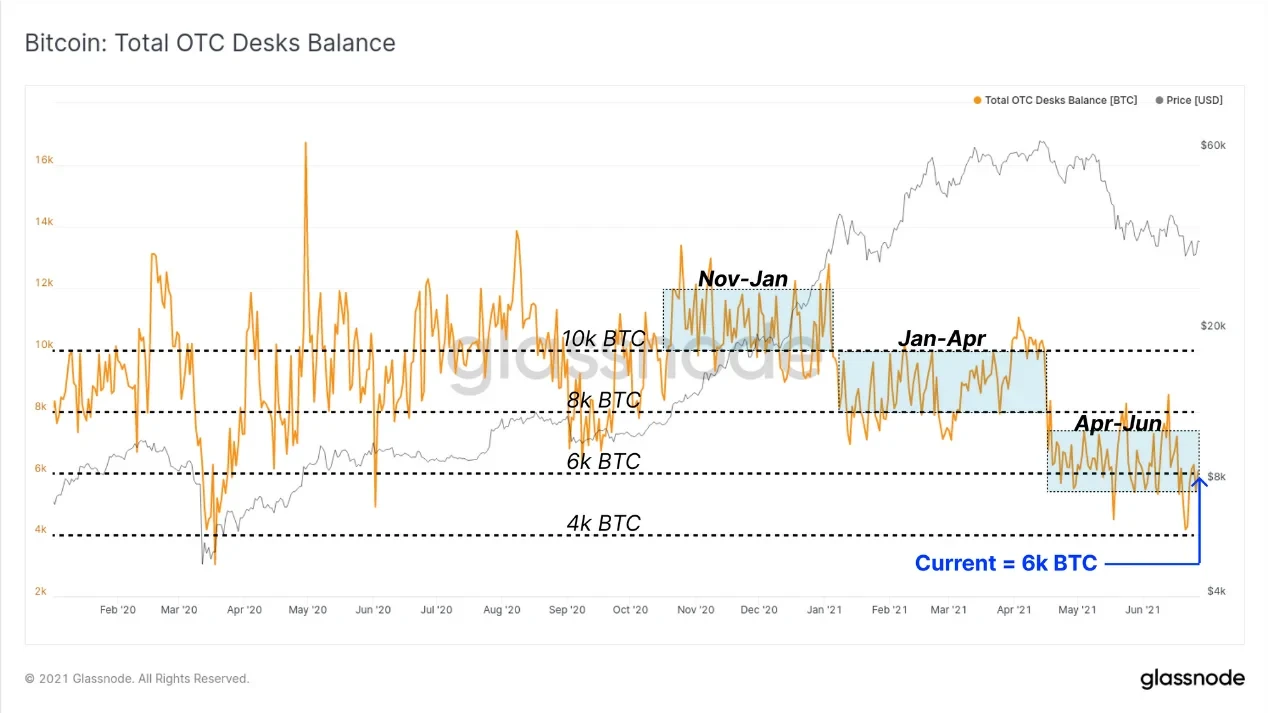
Additionally, Glassnode provided OTC balances, which is also the primary venue for large miners to sell Bitcoin. It can be seen that throughout 2021, OTC balances have been gradually declining. From April to June, balances maintained between 6,000-8,000 Bitcoin, with net outflows of 1,134 Bitcoin over the past two weeks.
Last Wednesday, JPMorgan stated in a report sent to investors that for more than a month since Bitcoin's crash on May 19, Bitcoin funds have continued to lose money. Although inflows into physical gold ETFs have stopped, not many institutions have joined Micro Strategy's buy-the-dip action. Current price levels have reduced institutional interest in Bitcoin.
Glassnode's weekly report similarly reached the conclusion that institutional demand is slowing. The Bitcoin price increase in this bull market has primarily benefited from institutional demand, with the largest factor being one-way Bitcoin inflows into Grayscale's GBTC trust seeking arbitrage under high premiums.
However, since March, Grayscale has closed GBTC fundraising due to negative premiums. After touching a maximum discount of -21.23% on May 13, GBTC's negative premium began to narrow, trading between -14.44% and -4.83% last week. This may be related to GBTC's efforts to convert to an ETF. Currently, the Grayscale GBTC trust holds over 651,400 Bitcoin, accounting for 3.48% of circulating Bitcoin.
Besides Grayscale, the two successful Canadian Bitcoin ETFs tracked by Glassnode also provide insight into institutional and retail investor demand for Bitcoin.
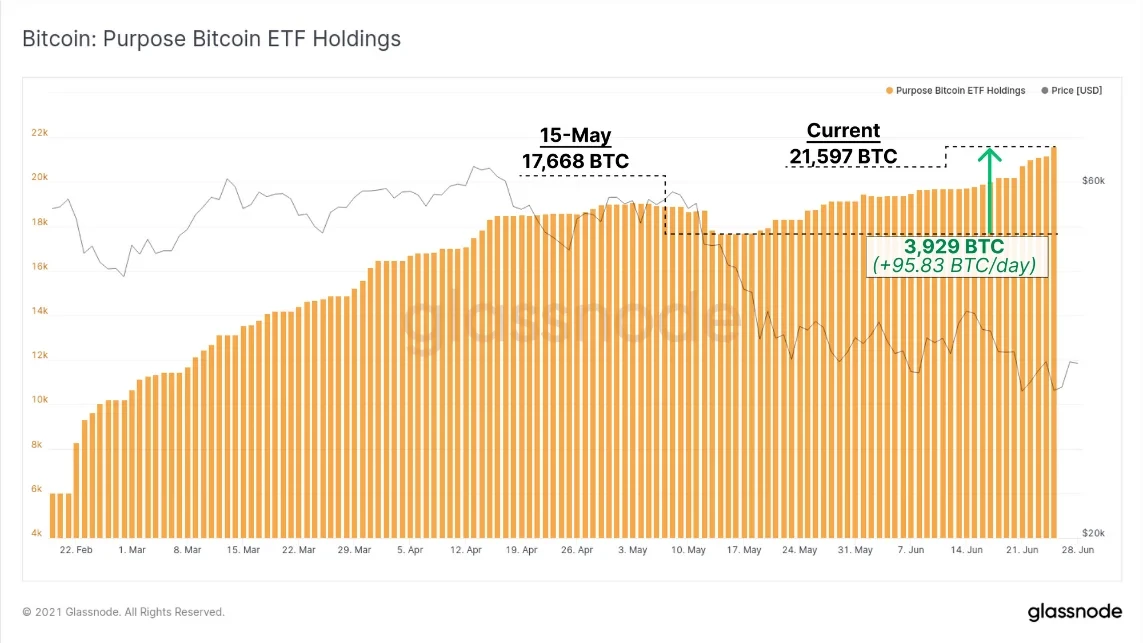
The amount of Bitcoin managed by Purpose Bitcoin ETF continues to grow, with net inflows of 3,929 Bitcoin since May 15, averaging 95.83 Bitcoin per day, bringing the total holdings of this Bitcoin fund to 21,597 Bitcoin.
Meanwhile, QBTC ETF experienced massive outflows over the past two months, with total holdings declining by 10,483 Bitcoin, and the fund currently holds 12,975 Bitcoin.
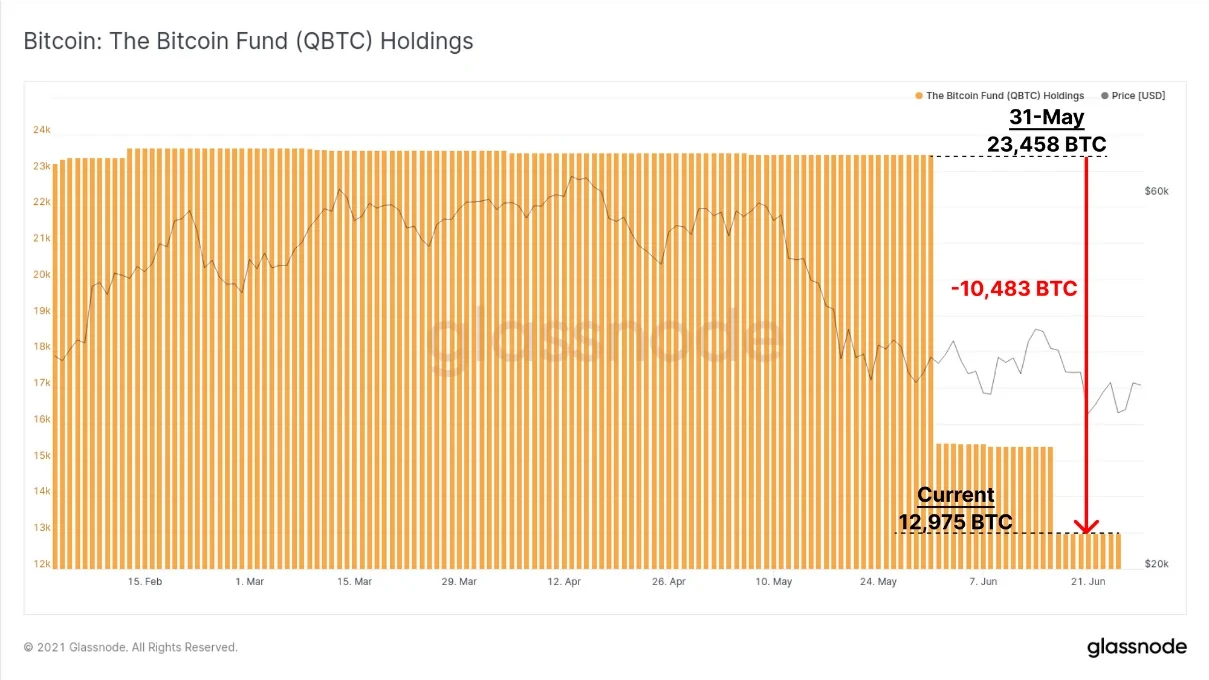
If we combine the net flows of these two Bitcoin ETFs from last month, we can see that a total of 8,037 Bitcoin flowed out of these two Bitcoin ETF products. When combined with Grayscale premium, Purpose Bitcoin ETF, and QBTC ETF, we can conclude that institutional demand remains lackluster, with no signs of significant buying.
DeFi activity slowing; Gas prices drop to last summer's lows
Crypto analytics platform Santiment reported on June 29 that the number of Ethereum active addresses exceeded Bitcoin active addresses for the first time, while Bitcoin active addresses are at their lowest level since February.
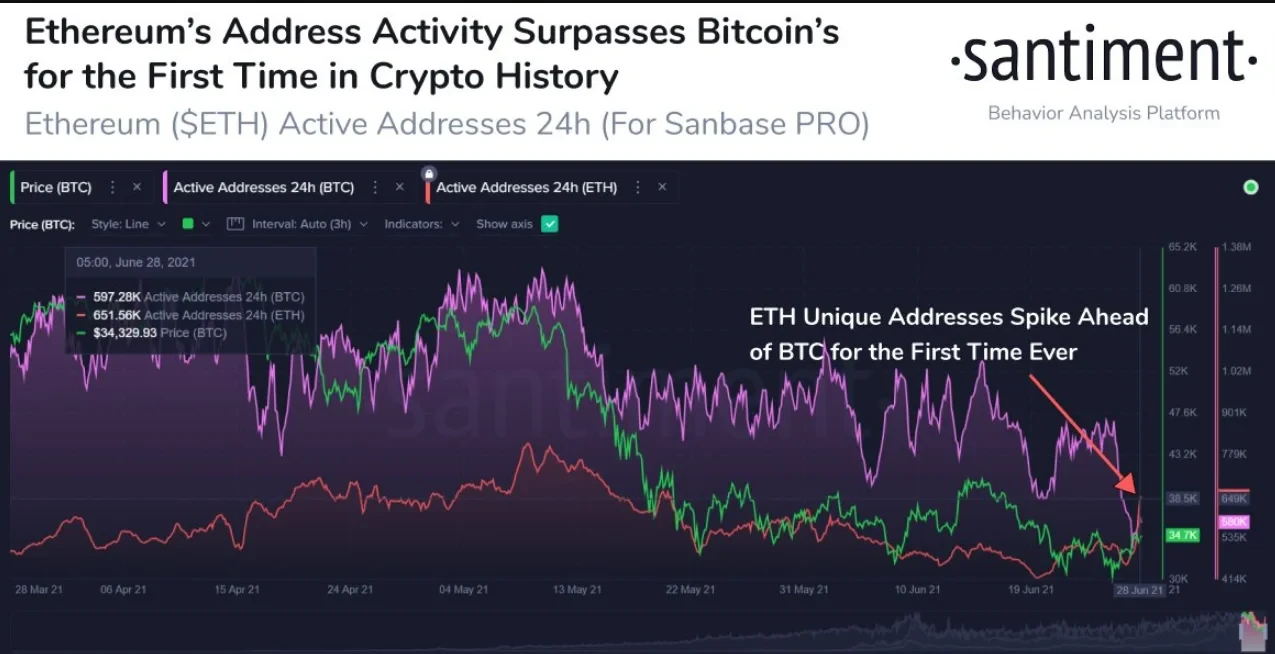
However, due to recent declines of varying degrees in DeFi tokens and lackluster returns with overall slowing activity, Ethereum's on-chain activity has declined.
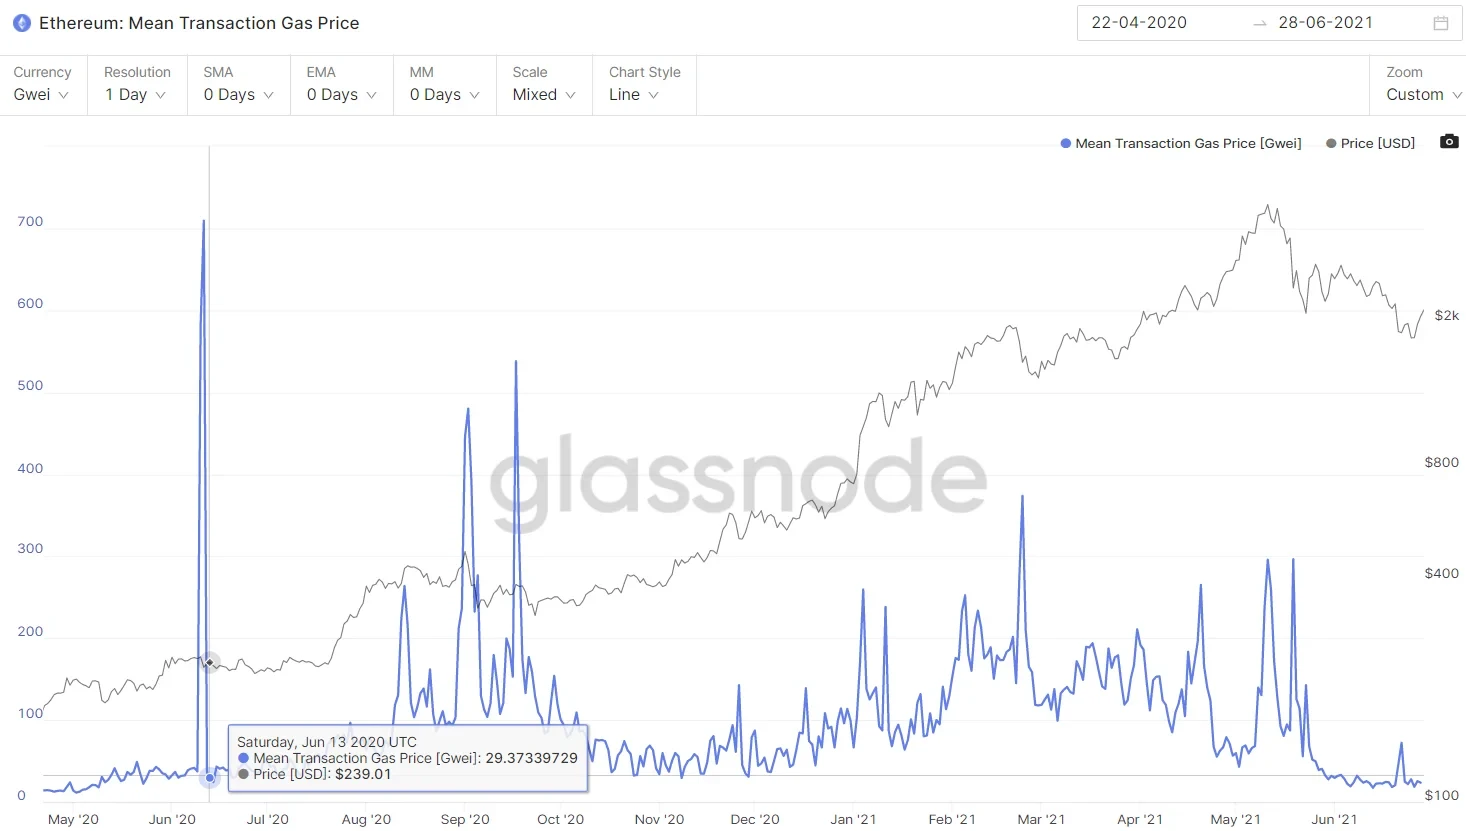
It is reported that Ethereum Gas prices have dropped to levels before the 2020 DeFi boom began.
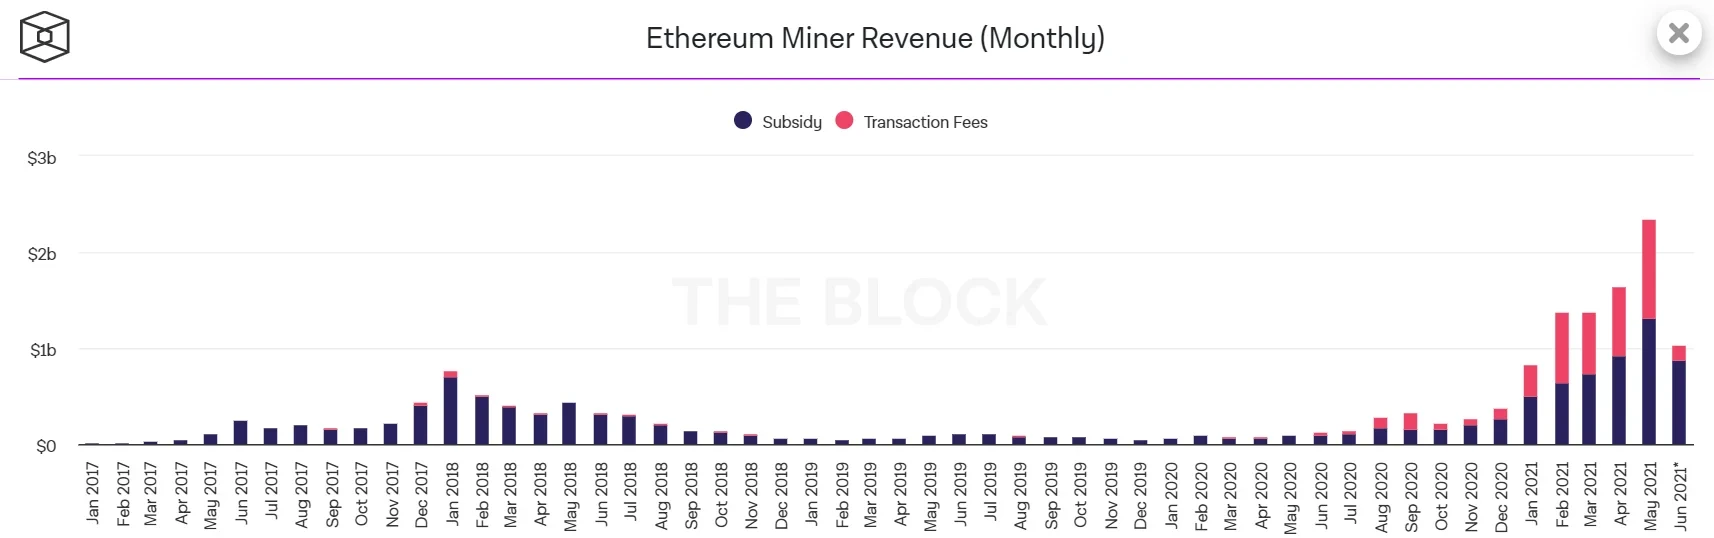
In our article "Bitcoin's mining progress bar is at 89%, do miners still have significant influence?", we mentioned that Ethereum miner revenue reached $2.35 billion in May, a historical high, with transaction fee income of $1.03 billion, accounting for 43.8% of total revenue, showing Ethereum fee income is nearly on par with block rewards.
But by June, as of June 28, Ethereum miner total revenue was $1.03 billion. In an incomplete comparison, this represents a 43.8% month-over-month decline. Among this, transaction fee income was $154 million, and block rewards were $880 million. Transaction fee income accounted for less than 15% of June total revenue.
OK Link data shows DeFi total value locked (TVL) has dropped to early April 2021 levels, at $70.88 billion.
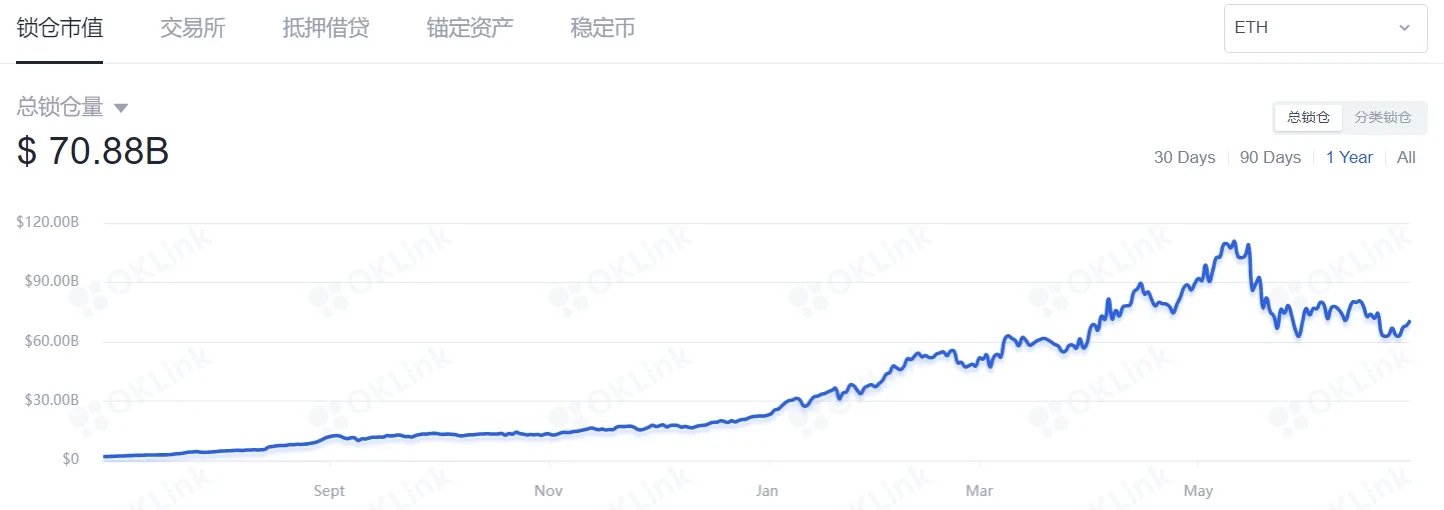
Throughout the bull market, DEX has dominated Gas consumption. Currently, DEX 24-hour trading volume has also dropped to March to early April levels, a decline of 77.5% compared to highs.
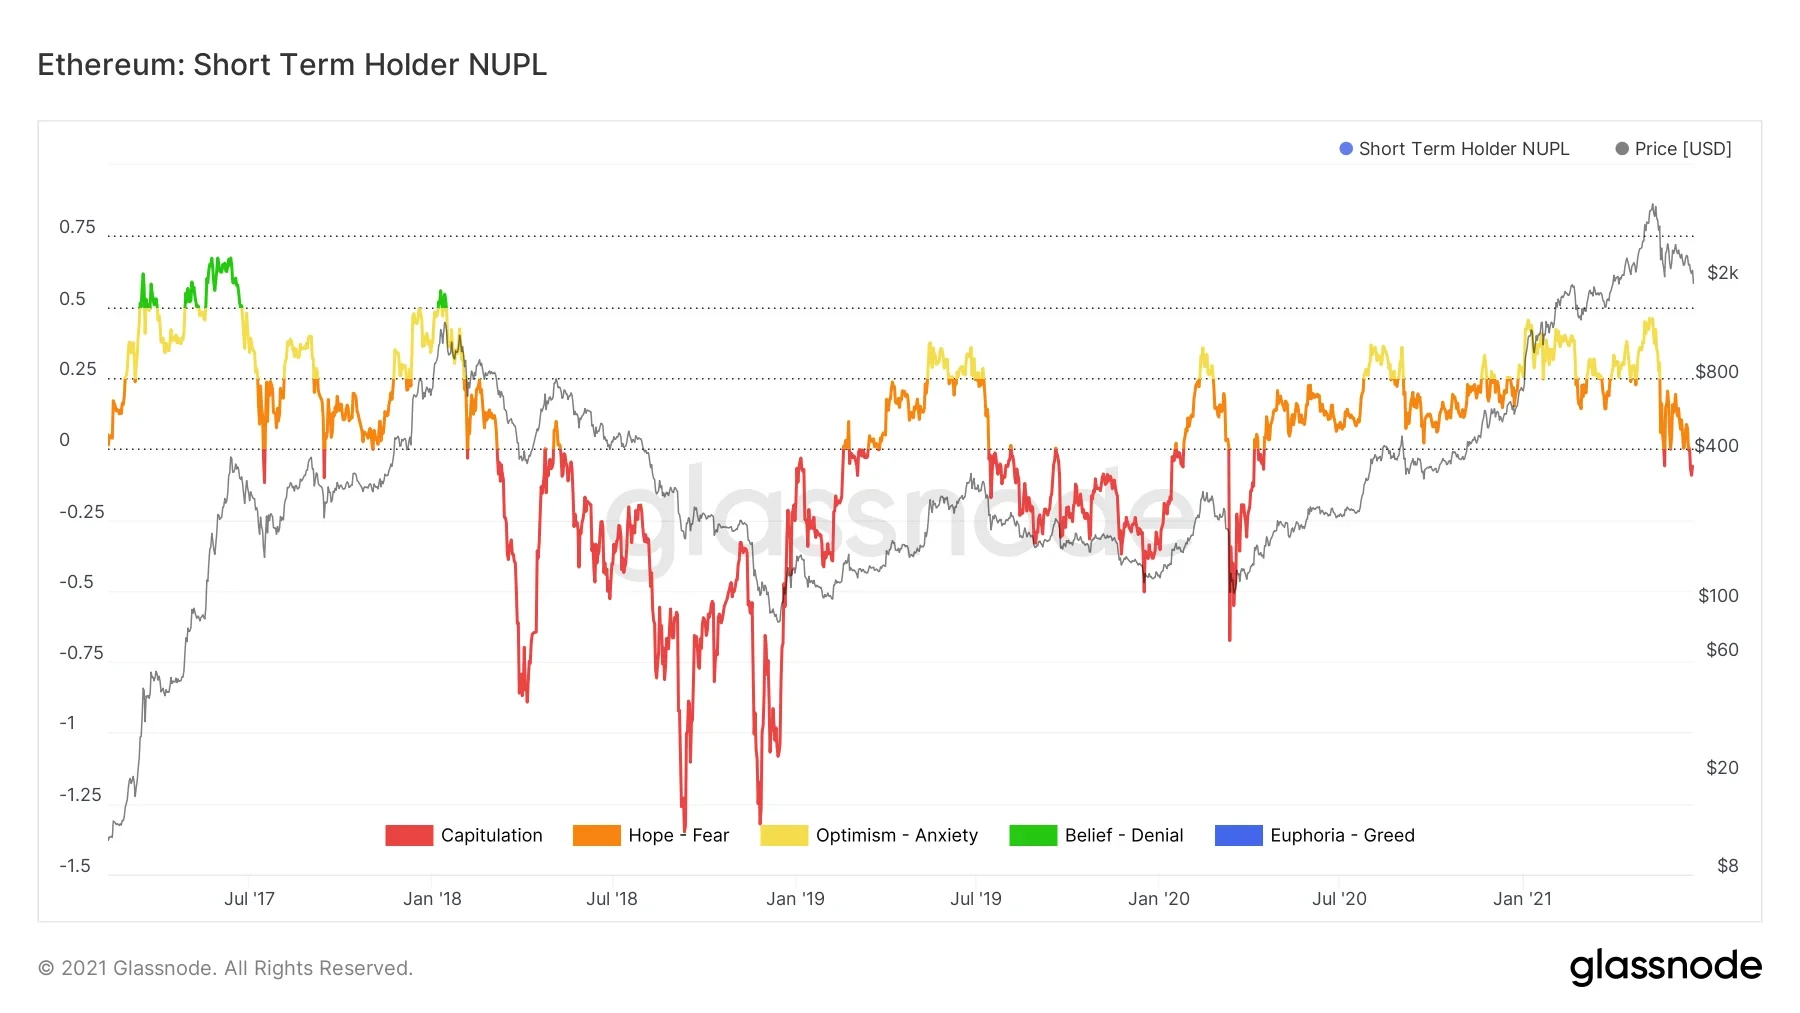
Due to the market downturn, short-term holders are currently watching their unrealized returns evaporate. We can clearly see their floating profits and losses from short-term holder NUPL (Net Unrealized Profit and Loss). Previously, short-term holder unrealized returns almost reached 46% of Ethereum's market cap, but now with price declines, their holding floating losses are at -25% of market cap. Given this decline magnitude, short-term holders likely purchased large amounts of Ethereum between $2,200 and the historical high, and these assets are currently underwater. The risk is that as prices recover to their cost basis, i.e., when STH-NUPL=0, these investors may sell to break even.
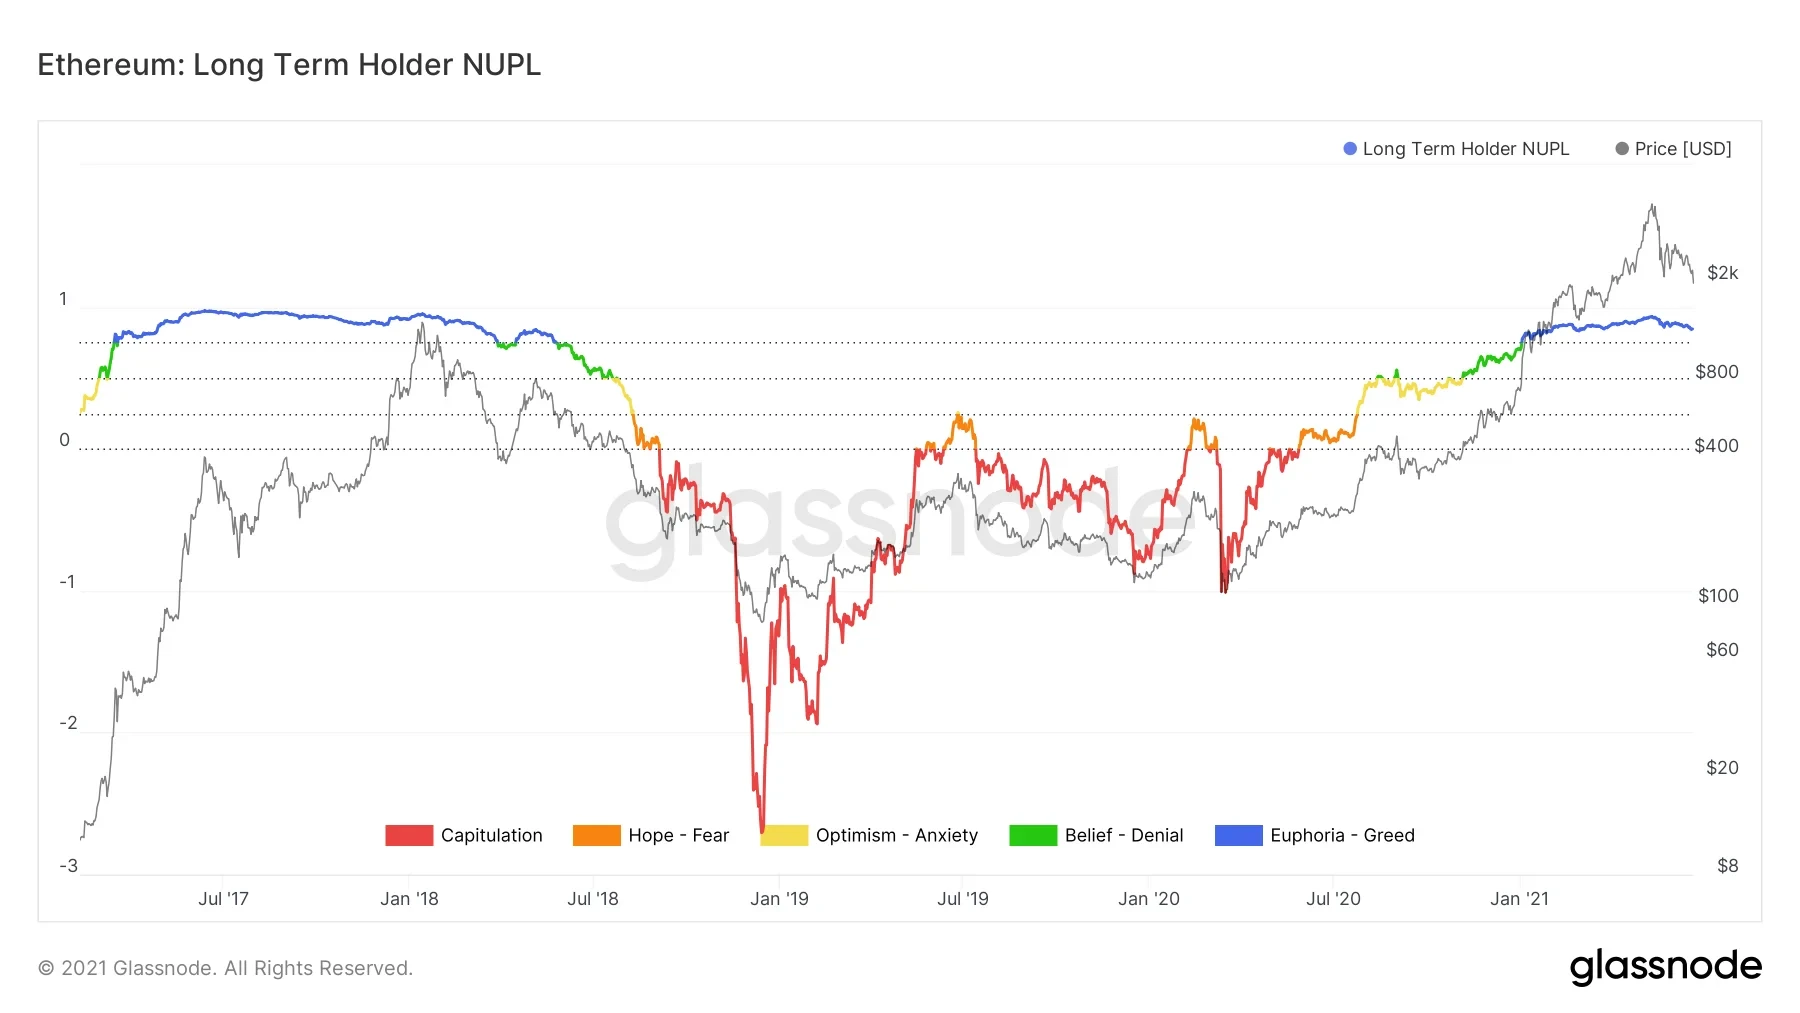
Long-term holders who purchased Ethereum more than 155 days ago remain profitable, but if the market continues to decline, these holders will also face a test of conviction. Comparing current price action to the January 2018 rally, at that time long-term investors chose to capitulate.
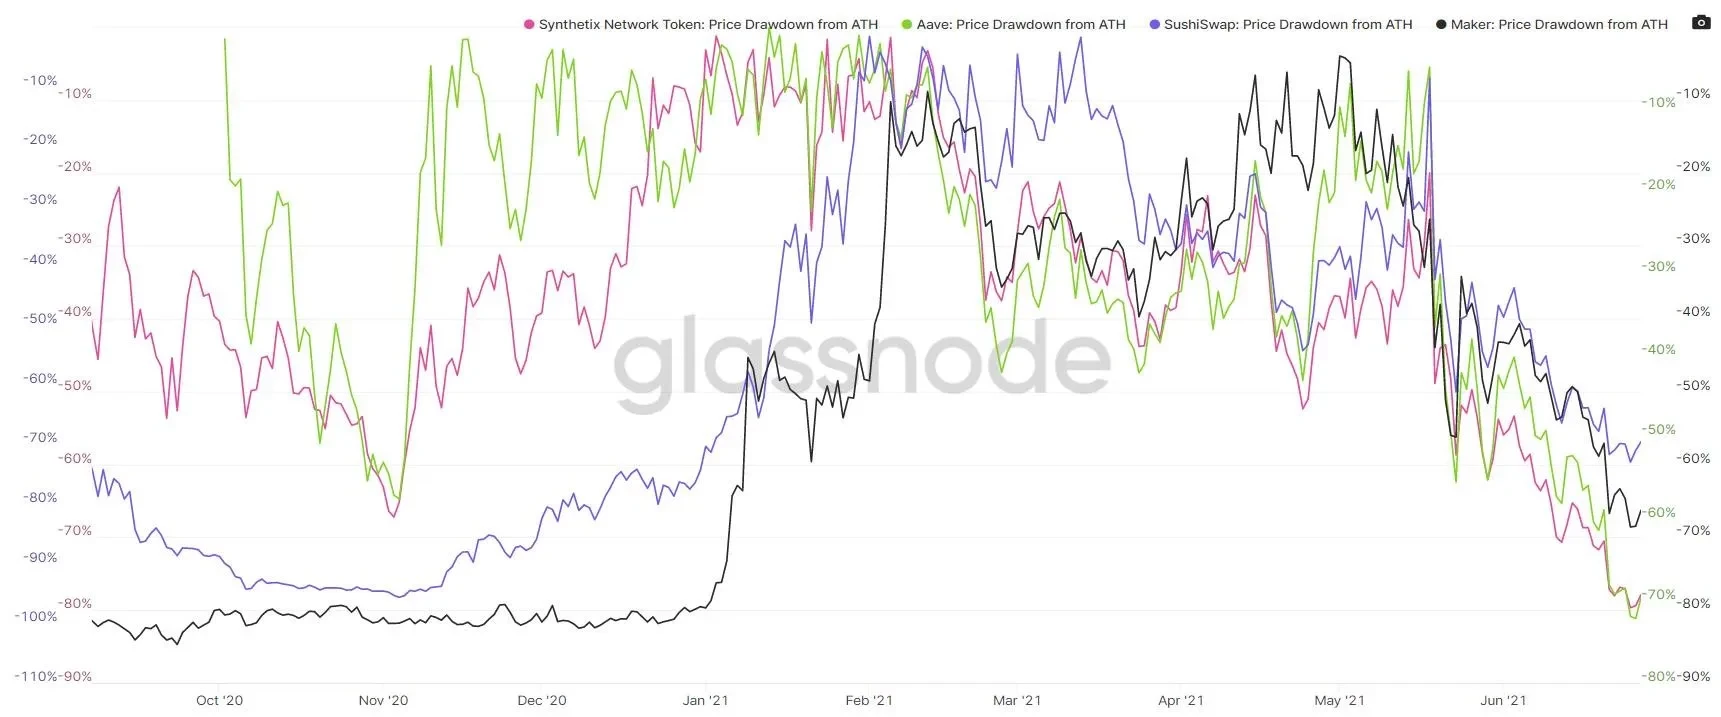
Fortunately, unlike 2018, long-term holders can now deploy their assets in DeFi. However, due to Bitcoin's consecutive two-month decline, most DeFi tokens have dropped over 50% from ATH, and many participants have entered a risk-off sentiment. OK Link data shows on-chain stablecoin circulation has reached $75.02 billion.
Yesterday, Cobo co-founder Shenyu posted that due to the market being flooded with large amounts of stablecoins, DeFi returns have also fallen惨ly. On June 28, DeFi risk-free returns were only 2.73% (taking the average of Aave and Compound USDC pool deposit APY, and CRV 3pool unboosted yield).
Some believe that with the arrival of the London upgrade, plus Layer 2 narrative stories showing more, and the transition to PoS 2.0, Ethereum's prospects are promising.
As the crypto market transitions to low-carbon, although we believe this is the necessary path for market transformation and development follows a tortuous upward trajectory, multiple on-chain indicators show weak market sentiment. It is unclear when and what event will inject new vitality into the market.
Disclaimer
This article may contain product-related content not applicable to your region. This article is intended to provide general information only and does not take responsibility for any factual errors or omissions therein. This article represents only the author's personal views and does not represent OKX's views. This article is not intended to provide any advice, including but not limited to: (i) investment advice or investment recommendations; (ii) offers or solicitations to buy, sell, or hold digital assets; or (iii) financial, accounting, legal, or tax advice. Holding digital assets (including stablecoins) involves high risk, may fluctuate significantly, and may even become worthless. You should carefully consider whether trading or holding digital assets is suitable for you based on your financial situation. For questions about your specific situation, please consult your legal/tax/investment professional. Information appearing in this article (including market data and statistics, if any) is for general reference only. Although we have taken all reasonable precautions in preparing these data and charts, we assume no responsibility for any factual errors or omissions expressed herein. © 2025 OKX. This article may be reproduced or distributed in its entirety, or excerpts of 100 words or less from this article may be used, provided such use is non-commercial. Any reproduction or distribution of the entire article must also prominently state: "Copyright © 2025 OKX. Used with permission." Permitted excerpts must cite the article name and include attribution, for example "Article Name, [Author Name (if applicable)], © 2025 OKX". Some content may be generated or assisted by artificial intelligence (AI) tools. Derivative works or other uses of this article are not permitted.
Show More