Rational Analysis: Does the "Double-Headed Bull" Logic Hold?
Since entering October, Bitcoin has continued to rise, first breaking through and stabilizing at $50,000, then surpassing the $60,000 mark this Friday, just one step away from its historical high. Consequently, the market is once again hearing voices about a "double-headed bull."
So from the perspective of the overall market environment, historical comparisons, and data indicators, does the "double-headed bull" logic hold? Will the "double-headed bull" market arrive as expected in the remaining less than 3 months of 2021?
Since the May 19 crash, people have continuously said: Bitcoin's halving cycle this time will be a "double-headed bull." As the market has continued to oscillate upward since mid-to-late July, these voices have grown increasingly louder.
Looking back even further, when Bitcoin first broke through $20,000 at the end of last year and the bull market officially began, some industry veterans predicted that this cycle might be a "double-headed bull" and compared it to the "double-headed bull" of Bitcoin's first halving cycle in 2013. So rationally analyzing, what is the "double-headed bull" logic? Does this logic hold?
Current Analysis: Is the Basic Logic of the Bull Market Still There?
What is the basic logic of a bull market? We elaborated on this in last month's article "Why Do Bull Markets Have Sharp Drops? How to Anticipate Market Crashes?", namely that the basic logic of a bull market rise is: continuous inflow of new funds. Other external factors only accelerate or decelerate this process: positive factors accelerate the bull market's progress but shorten its duration; negative factors delay the bull market's progress but extend its duration.
Knowing the basic logic of a bull market, is this logic still present now?
We know that one of the main reasons for starting this bull market was: the impact of the pandemic led to economic weakness worldwide, which in turn prompted central banks to massively print money. Taking the US Federal Reserve as an example, when the pandemic first broke out globally last year, the Fed printed $3 trillion in just 3 months. Fed Chairman Powell even explicitly stated that QE (quantitative easing) would become a conventional monetary policy tool for the Fed going forward.
This year, US President Biden first introduced a $1 trillion infrastructure plan, then the US House of Representatives voted 220-212 to pass a $3.5 trillion rescue plan... All these funds ultimately require the Fed to print US dollars, meaning the Fed's scale of money printing has not shrunk but rather expanded. According to statistics汇总 from historical data published on the Federal Reserve and US Treasury websites, since the COVID-19 outbreak in March 2020, the US has printed and released a total of $31 trillion in various dollar liquidity and economic stimulus packages in just 69 weeks.
Looking at the most recent Fed meeting (September 23), the Fed continues to maintain the benchmark rate at 0-0.25% unchanged. Although there are voices in the market believing the Fed may tighten monetary policy earlier than market expectations, it's also widely believed this won't happen until 2022 at the earliest.
Looking at the GDP performance of major world economies in the first half of this year, the US grew 6.2%, the UK 6.5%, India 9.3%, France 9.6%... The data seems good, but this growth is mainly due to dollar depreciation and economic contraction in the first half of last year caused by the pandemic. For example, India and France's high economic growth rates are because their contraction in the first half of last year was even greater - India's economy shrank 10.1% in the first half of last year alone, so neither India's nor France's economies have returned to pre-pandemic levels. From last year to now, the dollar index has cumulatively depreciated by over 10%. Major world economies' economic development remains relatively weak, so countries' money printing plans won't stop in the short term.
In summary, it can be seen that the main engine of this bull market - the quantitative loose monetary policies of various countries - won't change much in the short term, new funds in the market will continue to increase, and thus the basic logic of the bull market remains.
Historical Comparison: Will the Past Double-Headed Bull Repeat?
If we compare Bitcoin's overall trend in this bull market with the first halving cycle, we'll find惊人的 similar characteristics in their progression cycles.
Bitcoin's first halving was completed on November 28, 2012, then took more than 4 months to reach the first peak of this bull market at around $230 in April 2013, at which point Bitcoin had risen 20 times; then due to the market's own structural adjustments and external factors, it plummeted to around $68. After another 6 months of long oscillation, it finally broke through the April high in November 2013 and soared in the following month, reaching the second peak of this bull market in December 2013, which was also the highest point of the entire market cycle at $1169. As shown below:
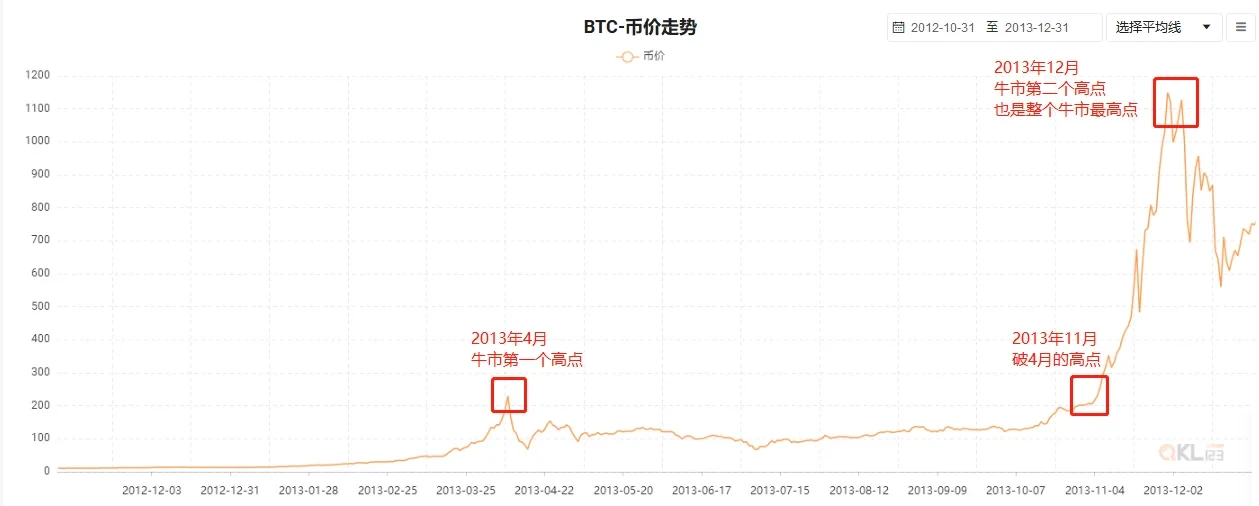
Bitcoin First Halving Cycle Chart (Source: qkl123)
Bitcoin's current bull market, the third halving, was completed on May 12, 2020, then took nearly a year to reach the first peak of this bull market at $64,846 on April 14, 2021 (OKX data), at which point Bitcoin had risen 8 times; subsequently also due to market structural adjustments and external factors, it plummeted to a low of $28,808. Now after 5 months of oscillation, it has again broken through $60,000, just one step from the historical high. As shown below:
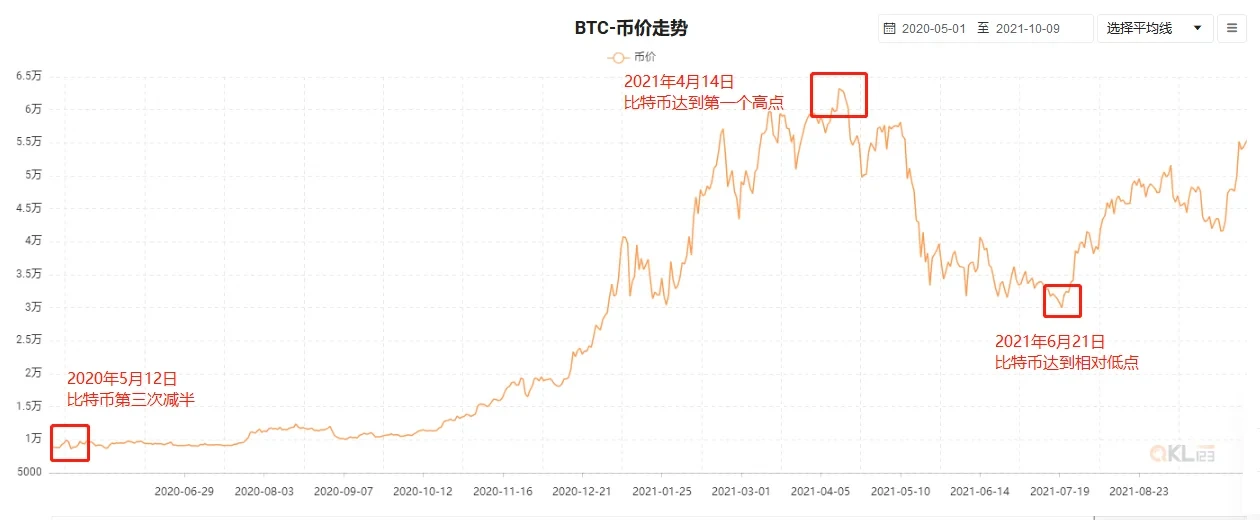
Bitcoin Third Halving Cycle Chart (Source: qkl123)
Of course, the overall environment and Bitcoin's own development in the two halving cycles are already very different. In terms of the overall environment, Bitcoin has gained widespread recognition and acceptance globally, especially as large numbers of traditional financial institutions such as listed companies, banks, investment banks, and funds from Wall Street have entered the market one after another, giving Bitcoin a more solid value foundation. Additionally, due to the development and prosperity of the crypto market itself, especially the continuous landing of numerous DeFi projects and the breakout of NFT concepts, Bitcoin and the entire market have gained a broad user base, meaning a higher ceiling compared to the first halving cycle.
From Bitcoin's own perspective, as Bitcoin continues to develop and mature, the duration of the entire crypto market bull market is also getting longer and longer. From Bitcoin's halving completion to the highest point of the entire bull market, the first halving cycle took one year, the second halving cycle took one and a half years, and the third halving cycle has currently been running for less than one and a half years. If we only look at duration, then this cycle hasn't reached its end yet.
Mark Twain said, history doesn't repeat, but it always rhymes! Although prediction methods based on rigid historical patterns may not be accurate, they can provide you with a perspective to see through the fog of the future.
Data Indicators: Are Visible Data Reliable?
With Bitcoin and the entire crypto market's development to today, a lot of data has been generated, and many data indicators have been produced to help investors judge market trends. Here we select two representative ones to see from a data perspective whether the "double-headed bull" logic holds.
First, from the Bitcoin Rainbow Chart below, we can see that this bull market's upside potential hasn't fully opened yet, and compared to the previous two bull markets, it's completely unlike a bull market top: the second bull market didn't truly peak and end until December 2017 when the Rainbow Chart reached the severe bubble phase; the first bull market didn't truly peak and end until December 2013 when it broke into the red zone, i.e., the severe bubble phase.
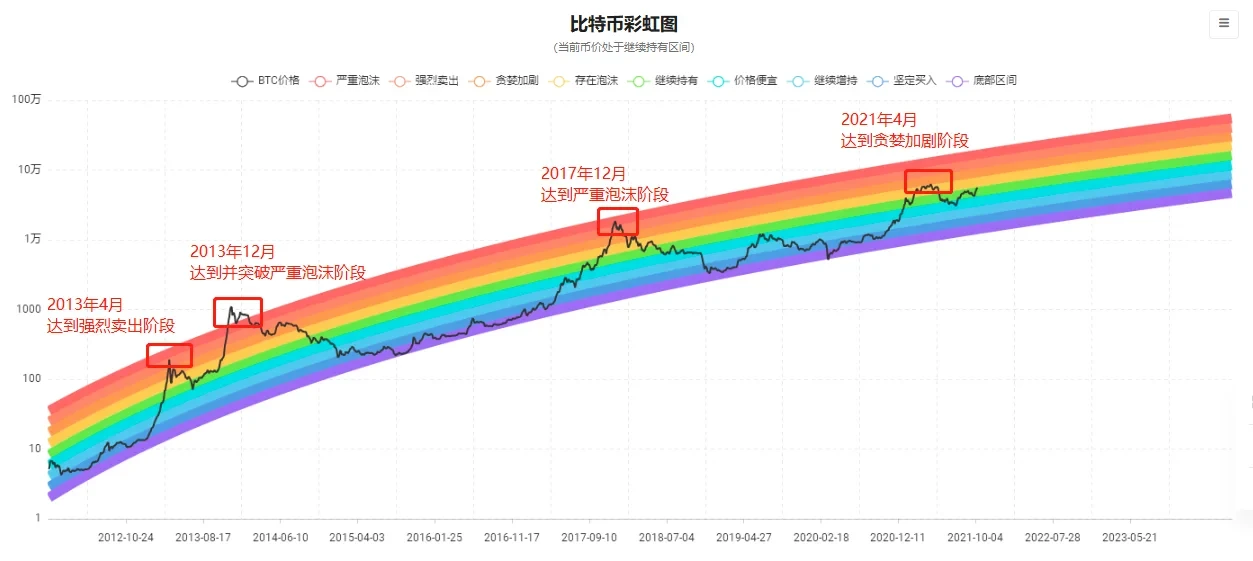
Bitcoin Rainbow Chart (Source: qkl123)
Looking at this bull market, it only just touched the "increasing greed" phase before the trend reversed, which is very similar to the April 2013 trend reversal, while the true top of that 2013 trend was in December.
Looking at Bitcoin's RHODL ratio (the ratio between the 1-week RHODL band and the 1-2 year RHODL band), in April 2021 Bitcoin's RHODL indicator hadn't even entered the red band, meaning the market hadn't reached the top of the cycle before the major correction began. Compared to the previous two cycles, in December 2017 and December 2013, the RHODL indicator entered the red band before the bull market truly ended. The April 2021 RHODL indicator decline is quite similar to the April 2013 decline. As shown below:
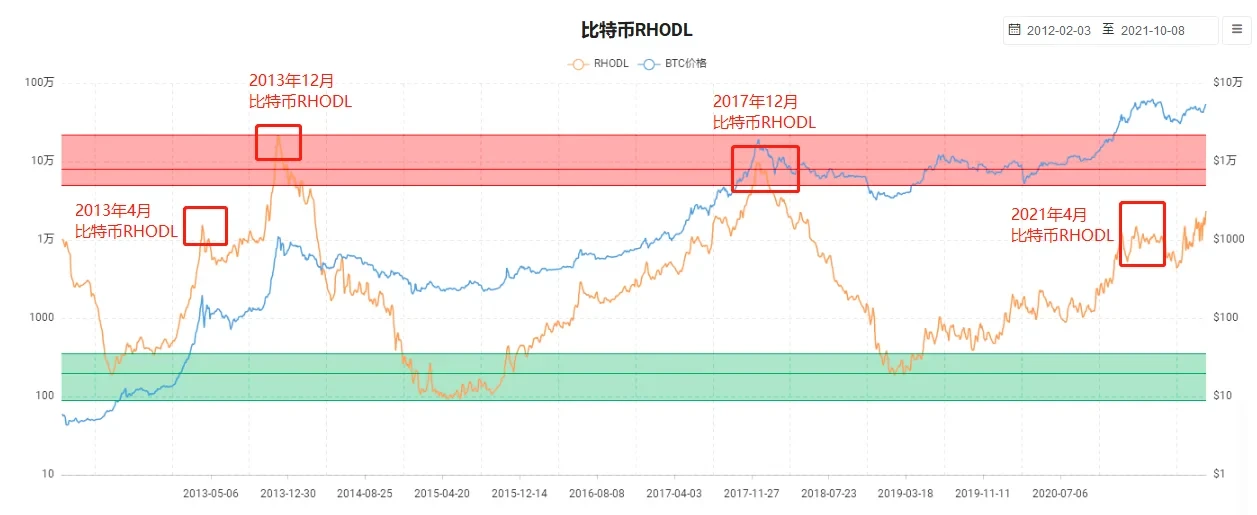
Bitcoin RHODL Ratio (Source: qkl123)
Of course, there are many data indicators in the market that can be referenced, such as: the recently popular S2F model, NUPL indicator, ahr999 accumulation indicator, etc. Due to space limitations, here we only cite two data indicators that have been market-verified.
Conclusion
From the above content, we can see that the "double-headed bull" is logically sound, but whether it will arrive as expected in reality? When will it arrive? These are difficult to predict, and the only thing we can do is maintain patience.
Disclaimer
This article may contain content related to products that are not available in your region. This article is intended only to provide general information and is not responsible for any factual errors or omissions herein. This article represents only the author's personal views and does not represent OKX's views. This article is not intended to provide any advice, including but not limited to: (i) investment advice or investment recommendations; (ii) offers or solicitations to buy, sell or hold digital assets; or (iii) financial, accounting, legal or tax advice. Holding digital assets (including stablecoins) involves high risk, may fluctuate significantly, and may even become worthless. You should carefully consider whether trading or holding digital assets is suitable for you based on your financial situation. For questions about your specific situation, please consult your legal/tax/investment professional. The information appearing in this article (including market data and statistics, if any) is for general reference only. Although we have taken all reasonable precautions in preparing these data and charts, we assume no responsibility for any factual errors or omissions expressed herein. © 2025 OKX. This article may be reproduced or distributed in full, or excerpts of 100 words or less from this article may be used, provided such use is non-commercial. Any reproduction or distribution of the entire article must also prominently state: "© 2025 OKX, used with permission." Permitted excerpts must cite the article title and include the source, for example "Article Name, [Author Name (if applicable)], © 2025 OKX". Portions of this content may be generated or assisted by artificial intelligence (AI) tools. Derivative works or other uses of this article are not permitted.
Show More
Recommended Reading
OKX Pay: Opening a New Era of Next-Gen Crypto Payments
The choice of tens of millions of users. Register OKX to enjoy ultimate trading experience and diverse wealth management products. A letter from OKX CEO Star: Today, we officially launch the first version of OKX Pay to over 100 million global users. As the industry's first payment app to truly achieve non-custodial and compliant integration, OKX Pay will be embedded in the OKX App, currently available to select markets, and expected to fully launch within months
March 22, 2026

New Chapter: Building Next-Gen Financial Infrastructure Together
The partnership between OKX and Intercontinental Exchange (ICE) is an important moment for OKX and equally significant for the evolution of the entire digital asset market. ICE establishes and operates the world's most important financial infrastructure, including the New York Stock Exchange and global derivatives and clearing platforms. This investment by ICE in OKX and joining our board reflects both parties' shared belief—that digital asset technology will be in financial markets
March 10, 2026

Tribute to Another Year of Forging Ahead
As OKX's CEO and also a builder who remains true to our original mission, I'm proud to look back on OKX's extraordinary growth and progress this year. Despite many challenges, 2024 has been a year of focus, innovation, and resilience. We not only expanded and optimized our products, but also made important progress in launching transparent and compliant localized operations, while further strengthening our global management team. Notably, after experiencing
January 29, 2026

2025: Steady Progress Toward Financial Freedom Together
— Year-end letter from OKX Founder and CEO Star to global users "Financial freedom" is often misunderstood. It doesn't mean no rules, but rather having the right to choose when rules exist—and when the system is truly tested, it remains reliable and effective. This is exactly what we've focused on throughout 2025. First, I want to extend sincere gratitude to our global clients, partners, and regulatory authorities
January 16, 2026

OKX Officially Launches in Germany and Poland
Author: Erald Ghoos, CEO of OKX Europe Today is significant for OKX—and equally for crypto users across Europe. We have officially launched our fully compliant centralized cryptocurrency trading platform in Germany and Poland! For us, this is not just a geographic expansion, but a commitment to building the cryptocurrency future the right way: secure, transparent, and meeting local needs. If you're in Germany
October 21, 2025

Partnership Upgrade! OKX Partners with Standard Chartered to Expand European Market
On October 15, OKX Europe CEO Erald Ghoos stated that OKX is expanding its strategic partnership with Standard Chartered to the European Economic Area (EEA). Earlier this year, OKX first partnered with Standard Chartered in the UAE to launch the collateral mirroring program—a
October 15, 2025