Market Bulls and Bears at a Standoff: Prices at Another Crossroads
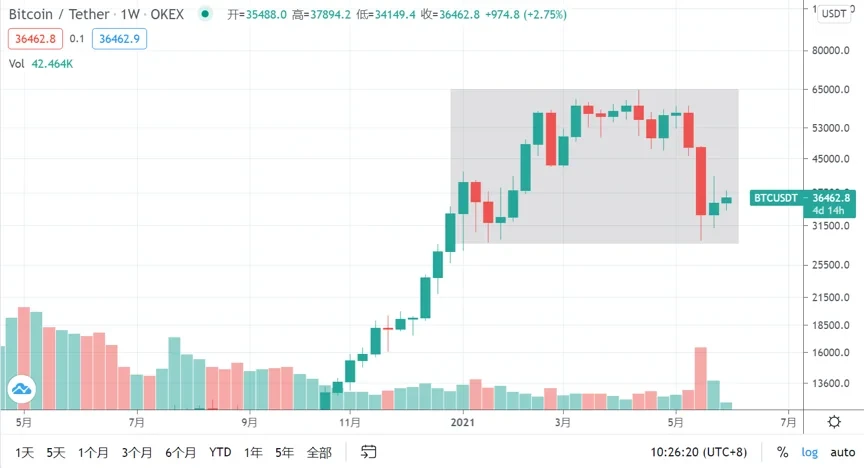
According to OKX market data, after Bitcoin fell from its high of $43,816 on May 19 to a low of $29,000, it quickly rebounded the following day and reclaimed the $40,000 level. However, it failed to hold that ground, and Bitcoin has since entered a consolidation phase. As of this writing, Bitcoin remains under pressure at $38,000. In the short term, if Bitcoin pulls back from a rally, it will continue testing whether the 250-day moving average on the daily chart can hold as support.
Spot Bitcoin trading volume remains relatively subdued. Futures open interest dropped from $17.49 billion on May 19 to $11.674 billion on June 1, a decline of 33.25%. As is well known, the sustainability of this bull market hinges critically on monetary policy. While a near-term shift in monetary policy seems unlikely, concerns surrounding inflation are intensifying. Until further news emerges, the market is unlikely to give a clear direction in the short term. Strong positive catalysts such as the SEC's approval of a Bitcoin ETF face uncertainty—the VanEck Bitcoin ETF application, whose review was already pushed back to June 17, is highly likely to be delayed further by the SEC.
Both the news landscape and on-chain data show that the crypto market is in a state of stalemate between bulls and bears. The market will continue to consolidate until a new consensus is reached. Due to the uncertainty, some analysts predict Bitcoin could fall to $27,000. On the other hand, as short-term speculators capitulate, hodlers and miners are reluctant to sell and are accumulating instead, keeping the market biased toward bullishness. In summary, the market has once again reached a point that tests conviction.
Eight Key Metrics Revealing the Divide Between Speculators and Hodlers
Throughout history, Bitcoin has exhibited strong cyclicality. Typically, during bear markets, only true Bitcoin believers continue buying Bitcoin—their single goal being to accumulate as much as possible when Bitcoin is at a value low. Then, during bull markets, as new speculators pour in源源不断地涌入, driving Bitcoin to史诗级般的上涨, hodlers may choose to sell and lock in profits. When Bitcoin changes hands, the accumulated holding days are reset and recalculated. When the supply of Bitcoin with short holding periods expands on the market, it means hodlers are steadily selling, and the broader market sentiment shifts accordingly. By comparing on-chain data, we can clarify the shifts in attitude between speculators and hodlers. Typically, the way their sentiment transitions also signals the direction of the bull-bear cycle to some extent.
Blockchain analytics firm Glassnode defines the boundary between speculators and hodlers at 155 days—Bitcoin held for fewer than 155 days classifies a holder as a speculator; those held longer are classified as hodlers.
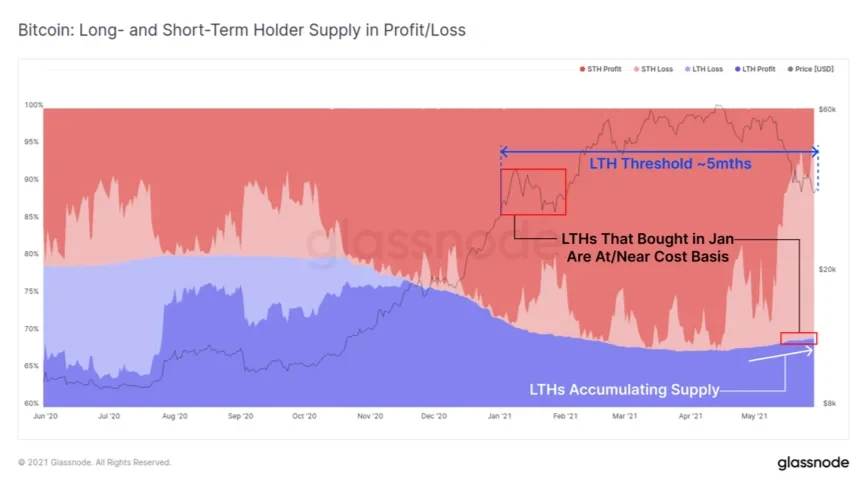
As shown in the chart below, Bitcoin's current trading price range is very close to the price 155 days ago. This means speculators who bought within those 155 days are most likely facing losses, while hodlers who bought 155 days ago are facing profit pullbacks, with the more extreme cases having already gone underwater.
Data 1: Profit/Loss Distribution of Bitcoin Hodlers and Speculators
The dark blue area represents profitable hodlers, accounting for 69% of Bitcoin's supply—these are buyers who acquired Bitcoin before early January 2021. The light blue section represents loss-making hodlers, accounting for 0.5% of Bitcoin's supply. The dark red area represents profitable speculators, currently holding 4.5% of Bitcoin's supply, while the light red section represents loss-making speculators. As Bitcoin's price plummeted, this area expanded rapidly and now accounts for 26%—these participants are likely to be the main source of selling pressure, both now and in the future.
Data 2: Speculator NUPL vs. Hodler NUPL
The data from Glassnode in Data 1 clearly shows the unrealized gains and losses of both hodlers and speculators. The NUPL (Net Unrealized Profit and Loss) of speculators and hodlers helps us identify their respective pain points—specifically, at what price level each group is likely to choose to sell.
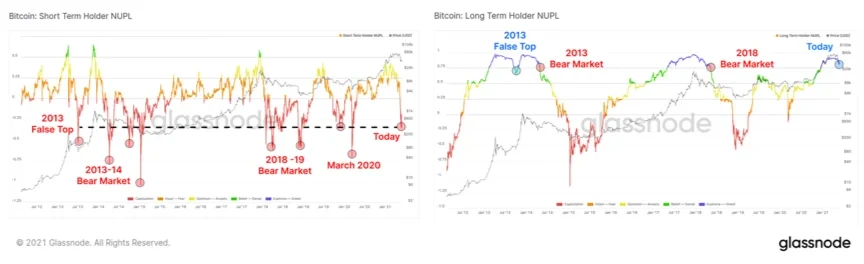
As shown in the left chart, speculators have largely capitulated, but they may continue to be the primary source of Bitcoin sell-side supply going forward. The right chart shows that while most hodlers remain in profit, their NUPL value is approaching the 0.75 threshold. Comparing against previous cycles, dropping below 0.75 marks the beginning of a bearish trend. Once a bearish trend takes hold, hodlers will also shift to become sellers.
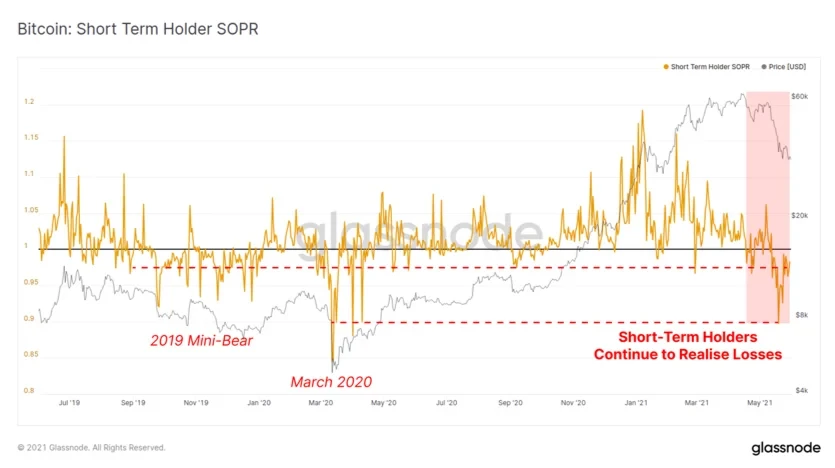
Data 3: Speculator SOPR
Looking at the speculator SOPR (Spent Output Profit Ratio—the ratio of selling price to buying price), we can clearly see that recently (the red area), speculators have been frantically selling tokens at a loss. Furthermore, this value has dropped below 1.0, and this wave of selling is even comparable to the capitulation data of speculators during March 2020. This illustrates that during Bitcoin's recent sharp decline, speculators have experienced large-scale capitulation.
Data 4: Bitcoin Spent Output Lifespan
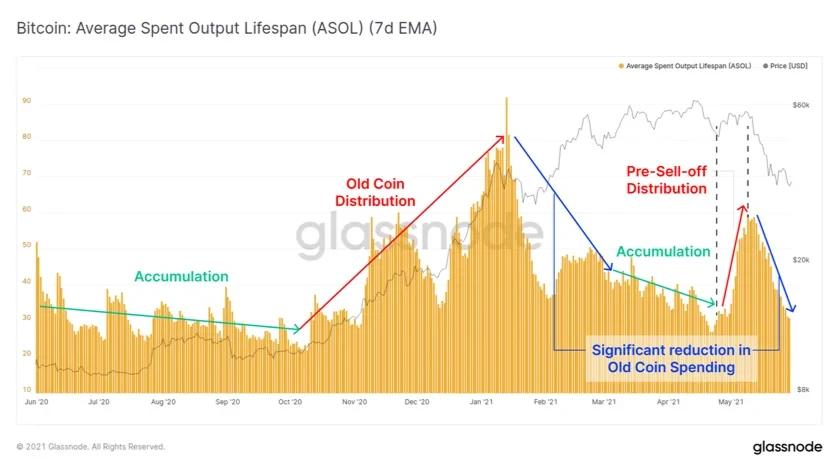
In Glassnode's latest report, we see an indicator called the "Average Spent Output Lifespan (ASOL)." A high value indicates that Bitcoin with longer holding periods is being moved and spent, while a low value means Bitcoin held for longer periods remains in storage and dormancy.
As shown in the chart below, ASOL values spiked in early May, possibly because investors anticipated that Bitcoin would underperform going forward, or perhaps because Ethereum's strong price performance caused funds to overflow into it. But by mid-to-late May, ASOL values clearly declined, once matching the accumulation levels seen during Bitcoin's climb from $50,000 to $60,000. This shows that rather than panic-selling during the decline, hodlers chose to hold.
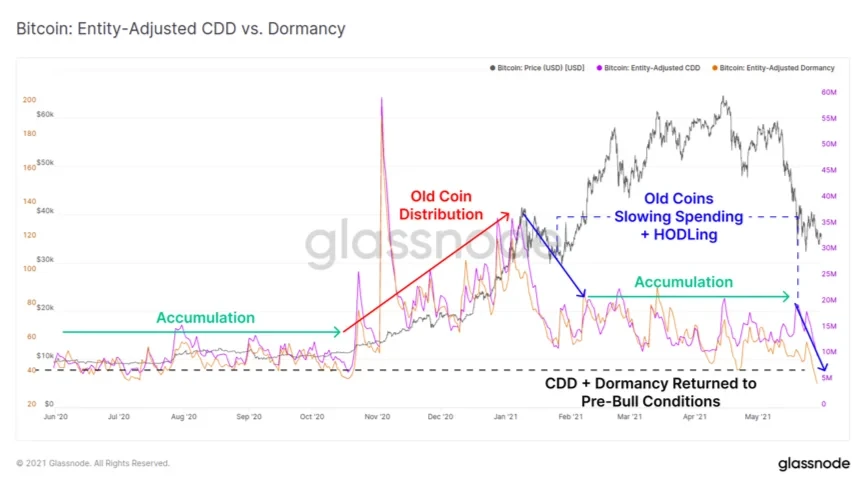
Data 5: Adjusted Coin Days Destroyed vs. Dormancy
In our article "BTC Aims to Hit $60,000 Again—How Long Will This Bull Market Last?", we introduced the Coin Days Destroyed (CDD) indicator. Coin days destroyed is considered a metric for measuring hodler behavior. The coin days destroyed for any transaction equals the amount of coins moved in that transaction multiplied by the number of days those coins remained unmoved. Therefore, the longer Bitcoin is held before being transferred, the higher the coin days destroyed value. Dormancy refers to the average number of days destroyed per Bitcoin transacted, calculated as the ratio of destroyed days to total transfer volume. Generally, a higher value is interpreted as long-term hodlers moving and spending Bitcoin.
It can be observed that during Bitcoin's rally from November 2020 to mid-January 2021, hodlers began selling. When the market hit its March-to-May highs, hodlers gradually reduced their spending and began holding instead. By the time of the major crash, the "CDD + Dormancy" metrics had even returned to pre-bull market levels, indicating that hodlers were in no rush to exit. If these values rise in the future, it would mean hodlers are moving Bitcoin again, which would create selling pressure.
Data 6: Realized Market Cap HODL Waves (Holding Period Under 3 Months)
HODL Waves are a commonly used indicator in the space for observing Bitcoin's holding periods, primarily monitoring Bitcoin through unspent transaction outputs (UTXOs).
As we mentioned earlier, Bitcoin believers always accumulate Bitcoin as cheaply as possible, then sell their Bitcoin for profit during the later stages of a bull market. Therefore, when Bitcoin with a holding period of less than 3 months surges, it signals that an increasing number of hodlers are inclined to sell Bitcoin.
We can see that during the two previous bull market peaks between 2013 and 2018, Bitcoin supply held in addresses under 3 months old spiked three times respectively. However, in this current bull market, as Bitcoin climbed to its highs, we only observed one major spike—far from reaching the levels seen in previous bull markets.
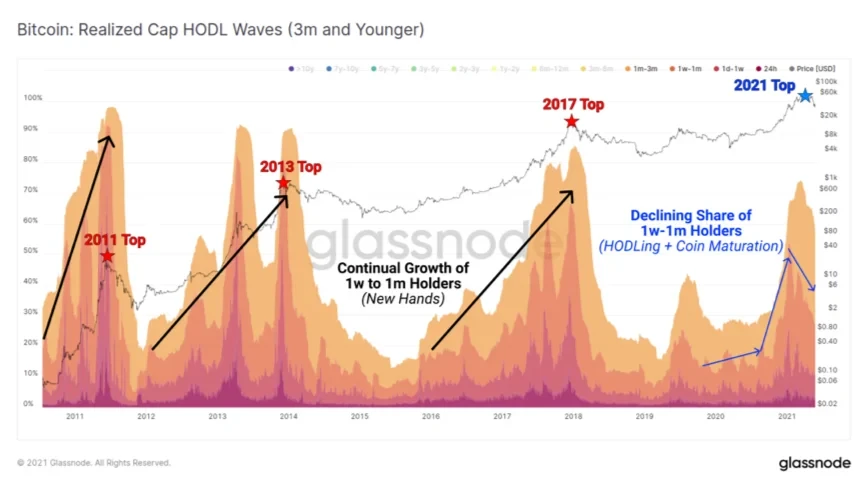
There are two reasons for this phenomenon. First, against the backdrop of global money printing, Bitcoin has gained macro-level support, along with intrinsic backing from advancing blockchain technology, which has strengthened the conviction of Bitcoin holders. Second, the growth of the Bitcoin derivatives market has reduced the on-chain footprint of holdings under 3 months.
Data 7: Hodlers vs. Speculators vs. Miners
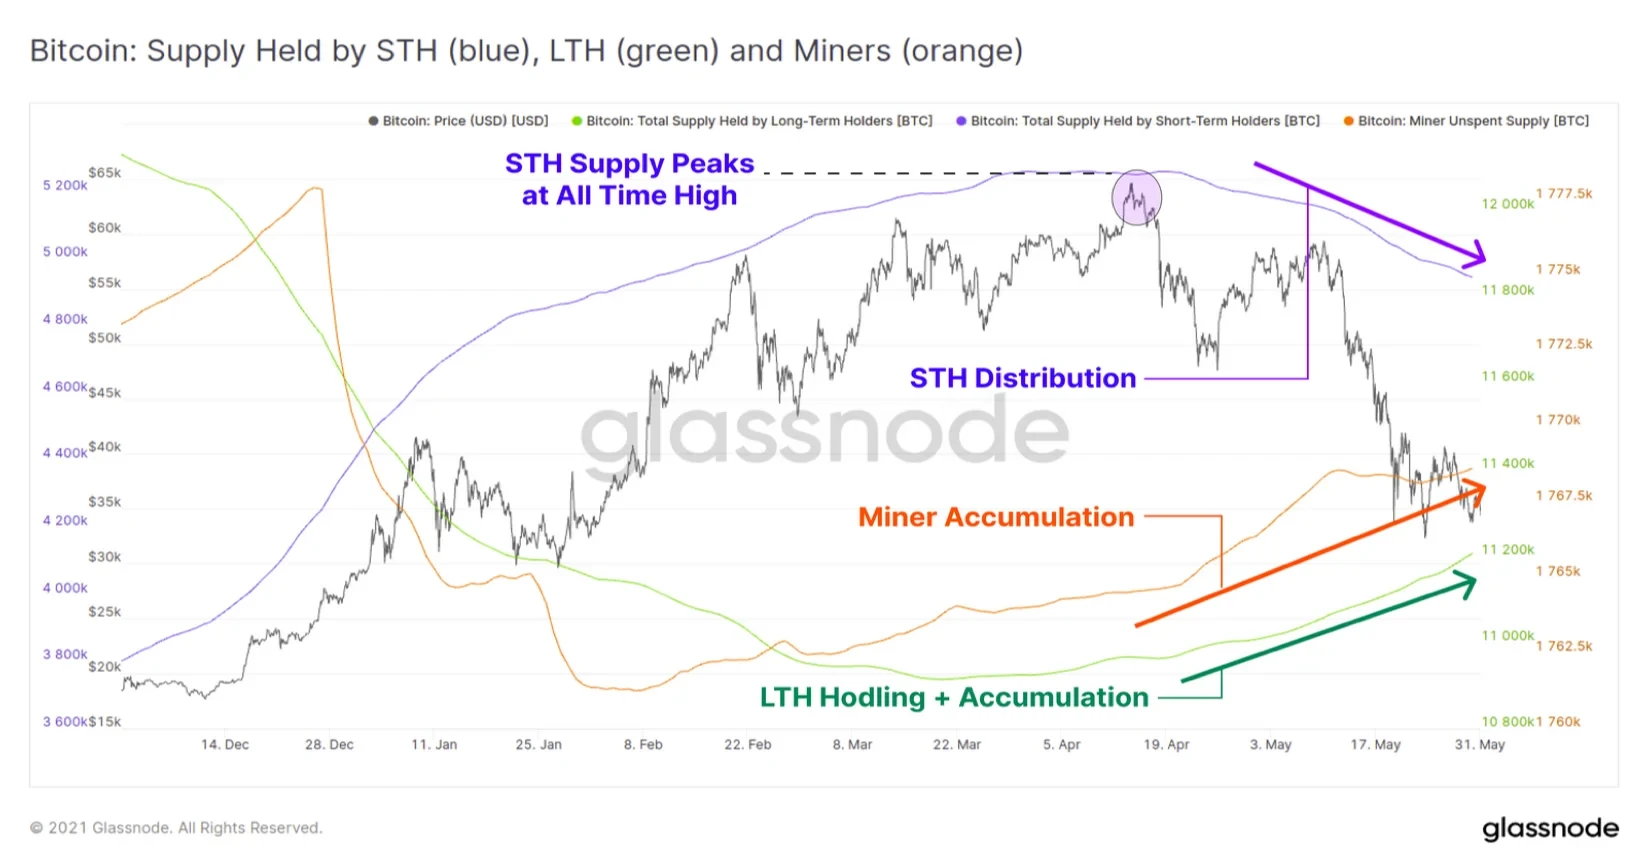
On May 31, Glassnode published a tweet stating that there are currently three supply trends in the Bitcoin market: short-term holders are selling, while long-term holders and miners are holding/accumulating. The chart below clearly shows that miners (orange line) and hodlers (green line) both increased their positions after the May 19 crash, while speculators (blue line) chose to sell. There is no doubt that we are currently at a time of severe divergence—it is a contest between the conviction of HODLers and short-term trading.
Data 8: Puell Multiple
Data 8: Puell Multiple
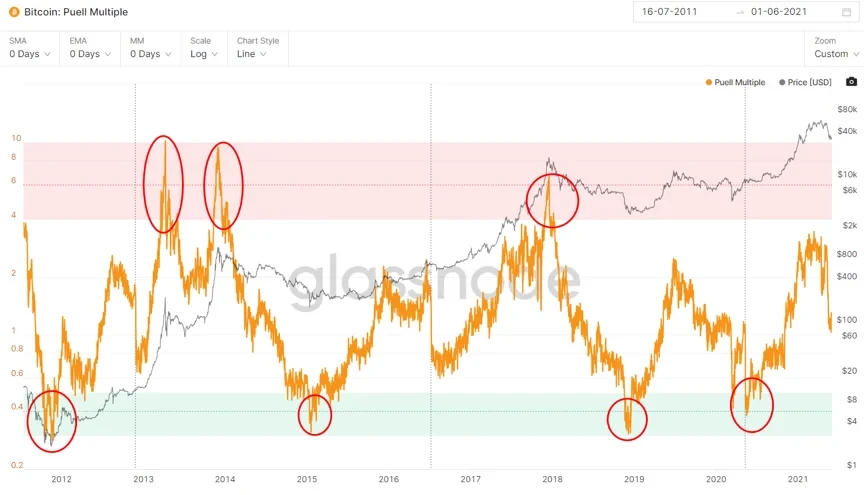
When it comes to miner behavior, the Puell Multiple also offers insight. The Puell Multiple is calculated by dividing the daily Bitcoin issuance price (in USD) by the 365-day moving average of the daily issuance price, and it is used to measure miners' profitability.
A high Puell Multiple indicates high profitability, meaning miners accumulated Bitcoin at prices far below market value and have an incentive to sell for greater profits. A low Puell Multiple indicates low profitability, in which case miners face revenue pressure. If this pressure persists, they will be forced to shut down machines, eventually leading to exit and forming a bear market bottom.
This bull market shows strong miner reluctance to sell—even at the previous highs of $50,000–$60,000, the Puell Multiple still could not match the levels of the previous two bull markets. Currently, as the market has declined, the Puell Multiple is retreating to levels comparable to November 2020.
Market Enters Consolidation Phase—Time to Test Conviction
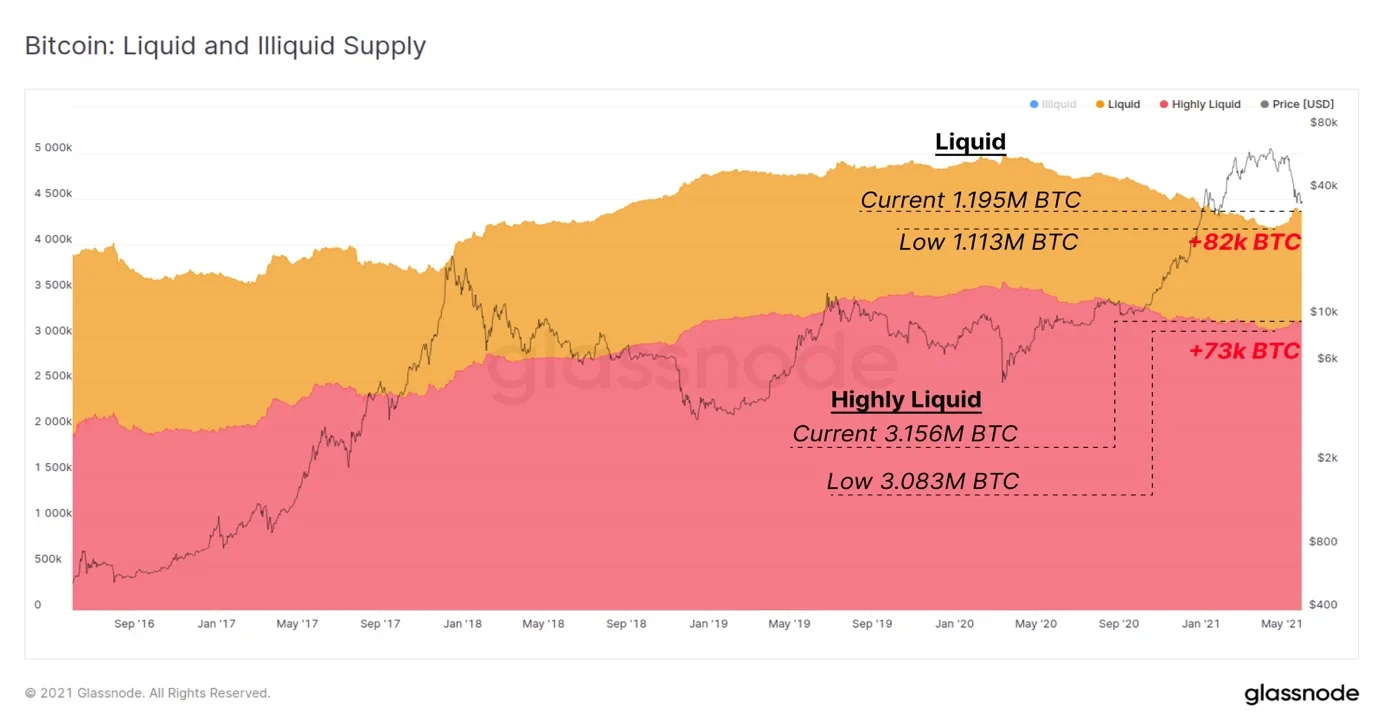
The liquid and illiquid (held) supply indicator shows that during mid-to-late May, as the market declined, a total of 155,000 Bitcoin transitioned from a held state to a liquid or highly liquid state—these liquid Bitcoin became selling pressure for the market.
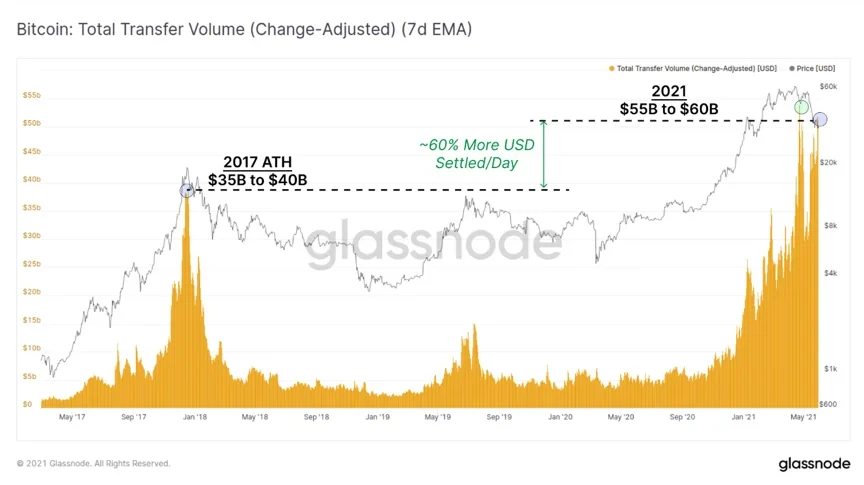
Additionally, during the week of May 24 to May 30, Bitcoin's total on-chain transfer volume ranged between $55 billion and $60 billion—far exceeding the peak of the 2017 bull market. A significant amount of Bitcoin is currently in circulation.
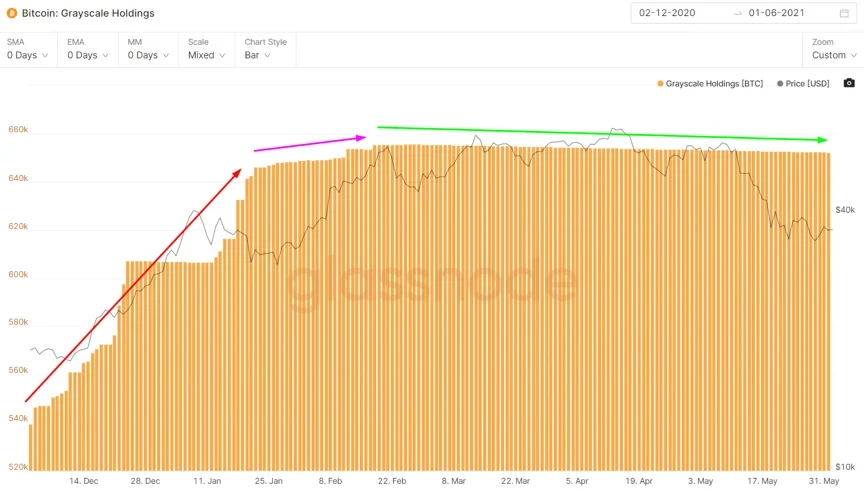
Institutional players, considered the main driving force behind this bull market, experienced weakened demand and were diverted by gold from February to May, but recently have shown signs of warming up. On one hand, major traditional institutions have expressed their intention to offer cryptocurrency services to clients, and prominent hedge fund managers such as Ray Dalio have expressed admiration for Bitcoin. On the other hand, Grayscale GBTC and Purpose Bitcoin ETF data have improved.
While Grayscale Bitcoin holdings were continuously rising (red arrow), GBTC trading premiums consistently stayed between 10% and 30%. When fund inflows began to decline (purple arrow), GBTC's premium fell below 10%. By late February, as fund inflows essentially stalled (green arrow), GBTC began trading at a discount.
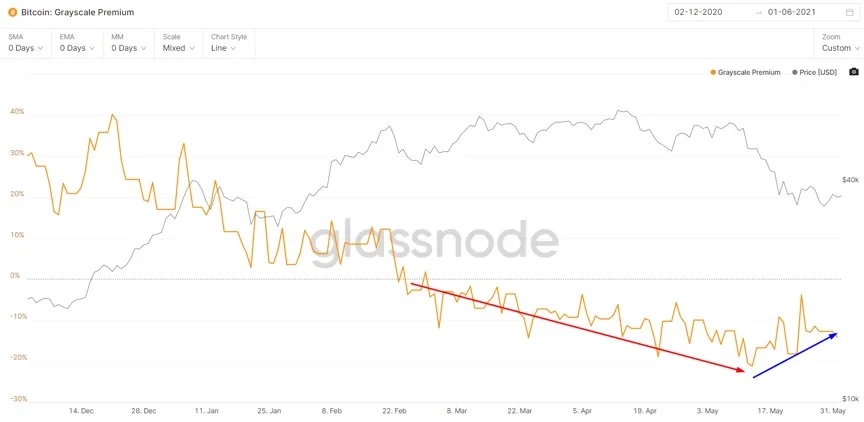
Grayscale premium data shows that as Bitcoin spot prices fell, the market experienced selling, and GBTC's discount has recently shown a narrowing trend.
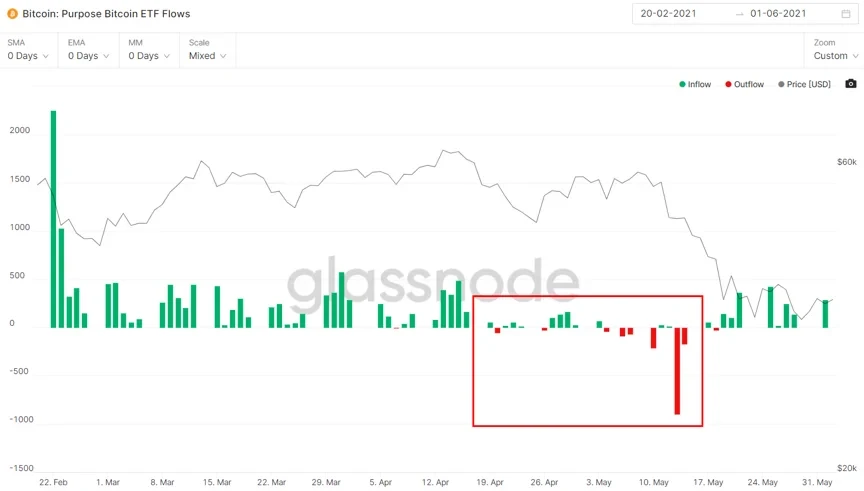
The Purpose Bitcoin ETF saw continuous capital outflows from mid-to-late April through early-to-mid May, but recently, funds have begun flowing back in.
Following consecutive declines, the Bitcoin derivatives market experienced large-scale deleveraging. Bybt data shows that Bitcoin futures open interest fell to $11.674 billion, a 33.25% decrease from May 19, and a 57.93% shrinkage compared to the peak on April 14.
With no clear positive catalysts, the community has turned to analyzing past bull market histories in search of guidance for the current situation. Among the ideas revived in this trend is the "halving bull market theory."

As shown in the chart above, after Bitcoin's first halving, it took 367 days to reach its high before the second halving. After the second halving, it took 525 days to reach its high before the third halving. If we use 525 days as the benchmark, this bull market's peak would appear on October 19, 2021. However, if there is a sequential increase in the number of days between cycle highs—specifically, if the difference between 525 and 367 (158 days) is added to 525—then this cycle would require 683 days from halving to its cycle high, placing the peak on March 26, 2022.
Beyond using the time from halving to cycle high to predict this bull market's peak, Jiang Zhuoer, a proponent of the halving theory, also provided a calculation method using the time from the previous cycle's low to high on Weibo, to further estimate this bull market's peak.
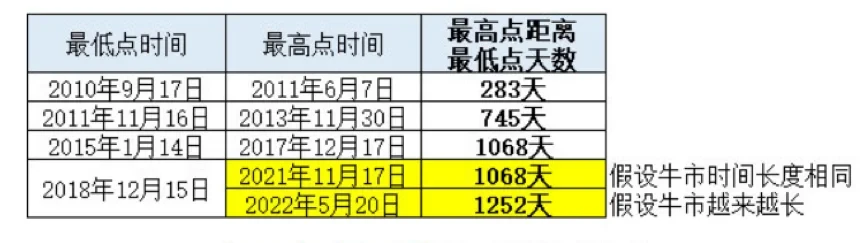
If we average October 19, 2021, March 26, 2022, November 17, 2021, and May 20, 2022, we arrive at January 28, 2022.
In our article "The U.S. SEC Re-Reviews Bitcoin ETF—Will It Be a Shot in the Arm for the Crypto Market?", we noted that the SEC extended the review period for the front-running VanEck application once again, from May 3 to June 17. Given the SEC's past behavior, this review window is likely to be further extended to 240 days. However, even if the SEC extends the review period, it must provide a clear approval or rejection by the end of the year. If the SEC approves a Bitcoin ETF, following the principle of "let the bullet fly," this bull market's peak might not arrive until around January 2022.
On-chain data shows that hodlers and miners are reluctant to sell, while speculators are selling. The so-called "halving bull market theory" offers a hopeful scenario that the cycle high may not arrive until late 2021 or early 2022. However, we must understand that all the indicators mentioned above represent only the tip of the iceberg among the many analytical tools available for the crypto market, and none are perfect—each has its flaws and controversies. The only undeniable fact is that we have indeed entered a consolidation period, a time of intense bull-bear博弈. After the unilateral rallies from the early to mid-bull market, the market has once again reached a moment that tests conviction…
Disclaimer
This article may contain product-related content that does not apply to your region. This article is intended solely to provide general information and makes no representation as to any factual inaccuracies or omissions. This article represents the author's personal views only and does not represent OKX's views. This article is not intended to provide any advice, including but not limited to: (i) investment advice or investment recommendations; (ii) offers or solicitations to purchase, sell, or hold digital assets; or (iii) financial, accounting, legal, or tax advice. Holdings in digital assets (including stablecoins) involve a high degree of risk and may fluctuate significantly, or even become worthless. You should carefully consider whether trading or holding digital assets is appropriate for you based on your financial situation. For questions about your specific circumstances, please consult your legal/tax/investment professional. Any information contained in this article (including market data and statistics, where applicable) is provided for general reference purposes only. While all reasonable precautions have been taken in the preparation of these data and charts, we accept no responsibility for any factual errors or omissions expressed herein. © 2025 OKX. This article may be reproduced or distributed in its entirety, or excerpts of 100 words or fewer may be used, provided that such use is non-commercial in nature. Any reproduction or distribution of the full article must prominently state: "This article is copyrighted © 2025 OKX, used with permission." Permitted excerpts must cite the article title and include the source, for example: "Article title, [author name (if applicable)], © 2025 OKX." Some content may have been generated or assisted by artificial intelligence (AI) tools. Derivative works and other uses of this article are not permitted.
Show More
Recommended Reading

OKX Pay: Ushering in the Next Generation of Crypto Payments
Trusted by tens of millions of users—register with OKX to enjoy an exceptional trading experience and a diverse range of wealth management products. A letter from OKX CEO Star: Today, we are officially launching the first version of OKX Pay to our global user base of over 100 million. As the industry's first truly non-custodial and compliant payment application, OKX Pay will be embedded within the OKX App, currently available in select markets with a full global rollout expected within months.
2026年3月22日

A New Chapter: Building the Next Generation of Financial Infrastructure Together
The partnership between OKX and the Intercontinental Exchange (ICE) marks a significant milestone for OKX and carries profound meaning for the evolution of the entire digital assets market. ICE builds and operates the world's most critical financial infrastructure, including the New York Stock Exchange and global derivatives and clearing platforms. ICE's strategic investment in OKX and appointment to our board reflects our shared conviction that digital assets technology will transform financial markets.
2026年3月10日

To Another Year of Building
As OKX's CEO and a builder who stays true to the original mission, I am proud to reflect on the extraordinary growth and progress OKX has achieved this year. Despite the challenges, 2024 was a year marked by focus, innovation, and resilience. Not only did we expand and improve our products, but we also made significant strides in launching transparent and regulation-compliant localized businesses, while further strengthening our global management team. It is worth noting that after going through.
2026年1月29日

2025: A Steady Progression Toward Financial Freedom
— Year-End Letter from OKX Founder and CEO Star to Global Users "Financial freedom" is often misunderstood. It does not mean the absence of rules, but rather the freedom to make choices even within a framework of rules—and more importantly, the assurance that when the system is truly tested, it remains reliable and effective. This has been our unwavering focus throughout 2025. First and foremost, I would like to express my sincere gratitude to our global customers, partners, and regulators.
2026年1月16日

OKX Officially Launches in Germany and Poland
By Erald Ghoos, CEO of OKX Europe. Today is a significant day for OKX—and for crypto users across Europe. We have officially launched our fully compliant centralized cryptocurrency trading platform in Germany and Poland! For us, this is more than a geographic expansion; it is a commitment to building the future of cryptocurrency the right way: secure, transparent, and tailored to local needs. If you are in Germany.
2025年10月21日

Partnership Upgrade! OKX and Standard Chartered Join Forces to Expand into Europe
On October 15, Erald Ghoos, CEO of OKX Europe, stated that OKX is expanding its strategic partnership with Standard Chartered to the European Economic Area (EEA). Earlier this year, OKX and Standard Chartered first partnered in the UAE, launching a collateral mirroring program—a.
2025年10月15日