2. Strategic Trading Series — Spot Grid
Foreword:
Markets spend most of the time in consolidation, with only a small portion of the time moving in trends. Although digital assets are highly volatile, taking BTC's trajectory from 2018 to present as an example, half of the time is spent in consolidation. During consolidation periods, whether you are HODLing or trading futures contracts, returns are unlikely to be satisfactory — this is determined by the market itself. Is there a relatively stable trading strategy to deal with this consolidation market? Today, we bring you the ultimate strategy tool for trading consolidation — grid trading.
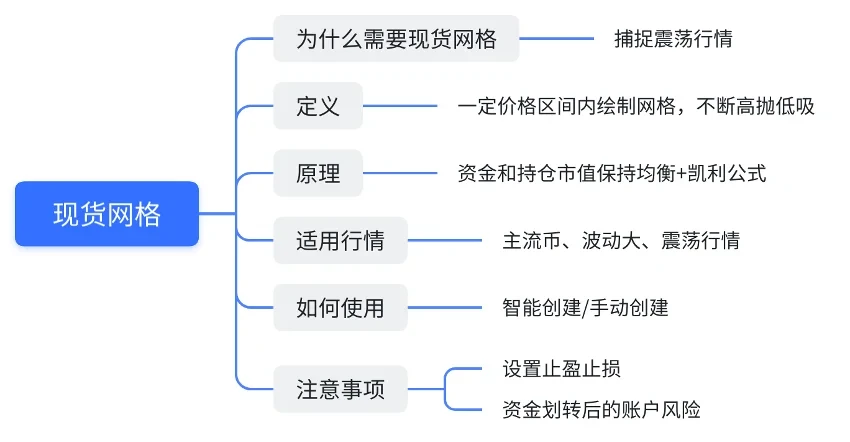
1. What Is Spot Grid
Spot grid trading, also known as grid trading in traditional finance, is a stable, secure, and low-volatility quantitative trading strategy that is widely used in stocks, futures, and forex trading.
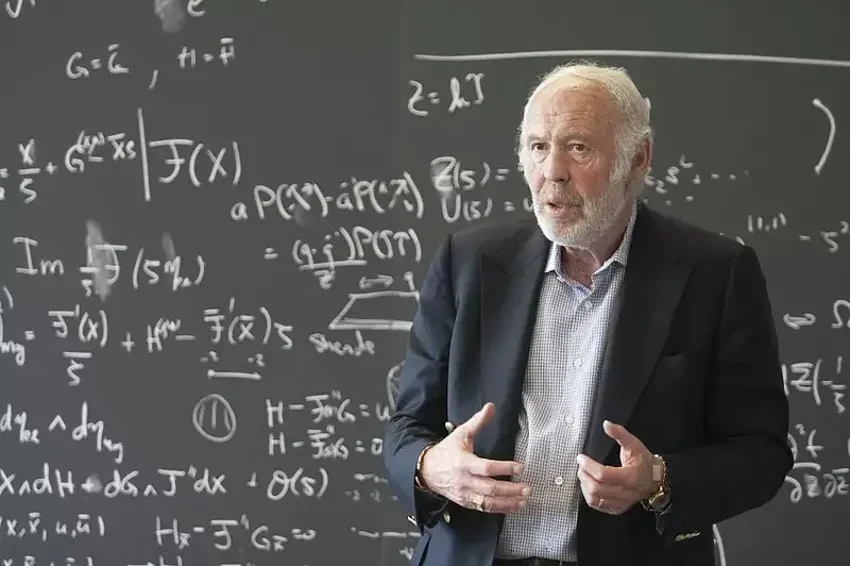
It was invented by a world-class mathematician, James Simons, who is also one of the greatest hedge fund managers. His Medallion Fund achieved an annualized return of 39.1% over 30 years from 1988 to 2018 — an astonishing track record.
2. How Spot Grid Works
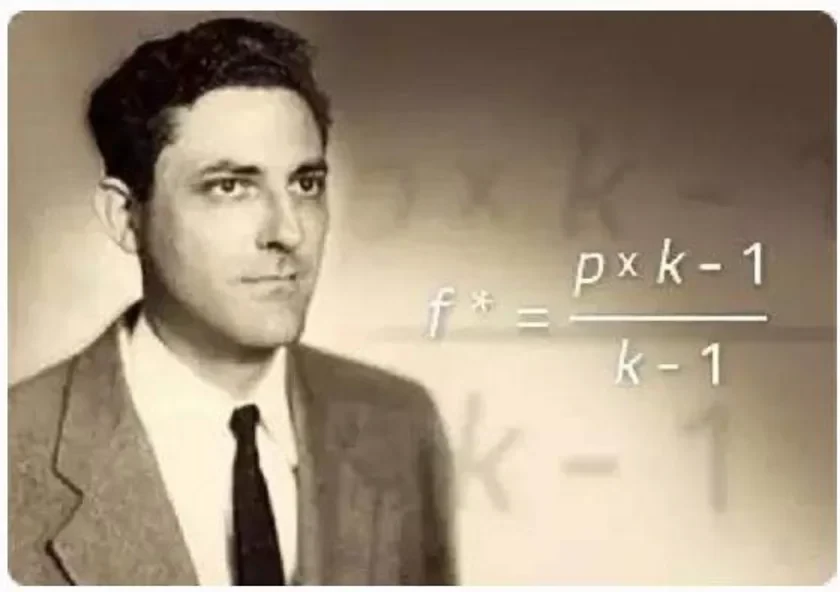
The principle of grid trading comes from the father of information theory, Shannon: Buy funds at 50% of any price level — that is, funds quantity: stock market value = 50%:50%. When the stock price rises by a certain margin, sell a portion of the stock, maintaining the remaining funds quantity: remaining stock market value = 50%:50%; conversely, when the stock price drops by a certain margin, use the remaining funds to buy more stock, always keeping funds quantity: stock market value = 50%:50%. This method is used to counter random price movements, and according to the Kelly Criterion, long-term trading is profitable.
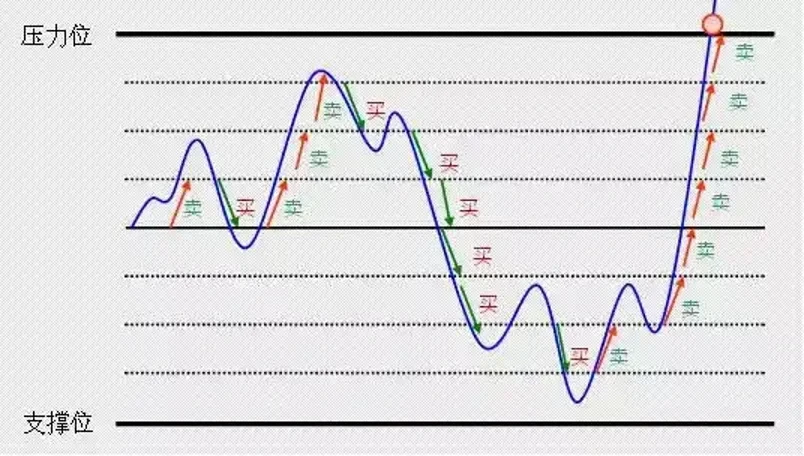
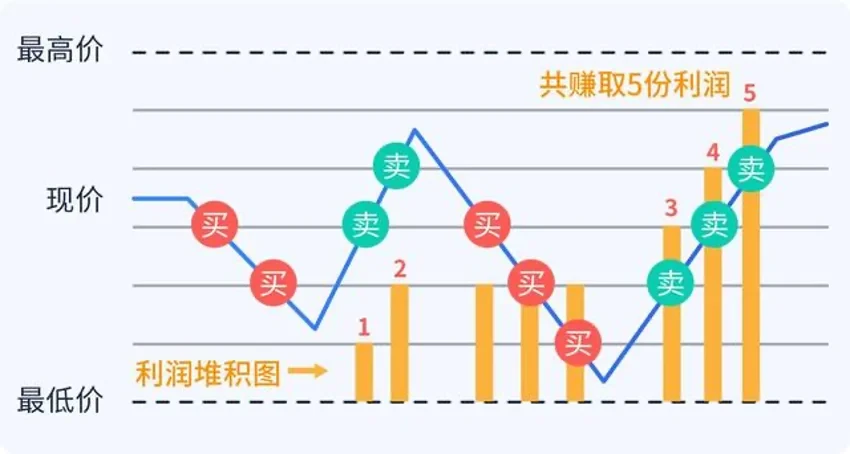
Spot grid refers to utilizing market consolidation to draw a grid within a certain price range. When the price touches a grid line, positions are added or reduced — buying low and selling high to continuously profit from trading. Spot grid is a contrarian trading approach: buying when prices fall and selling when prices rise. Around a central price, the strategy continuously executes the high-sell-low-buy cycle.
Trend trading is the approach that believes prices will continue moving along the trend until a force changes the current trend. Therefore, when prices are rising, it assumes the market will continue to climb and follows by going long; similarly, when prices are falling, it sells to cut losses or uses futures contracts to go short. Contrarian trading follows consolidation logic, while trend trading follows momentum logic — this is the fundamental difference between the two.
The following diagram shows examples of grid trading orders and fills.
3. What Market Conditions Are Suitable for Spot Grid
Spot grid works by buying low and selling high within a set range to steadily accumulate profits, making it best suited for consolidation markets.
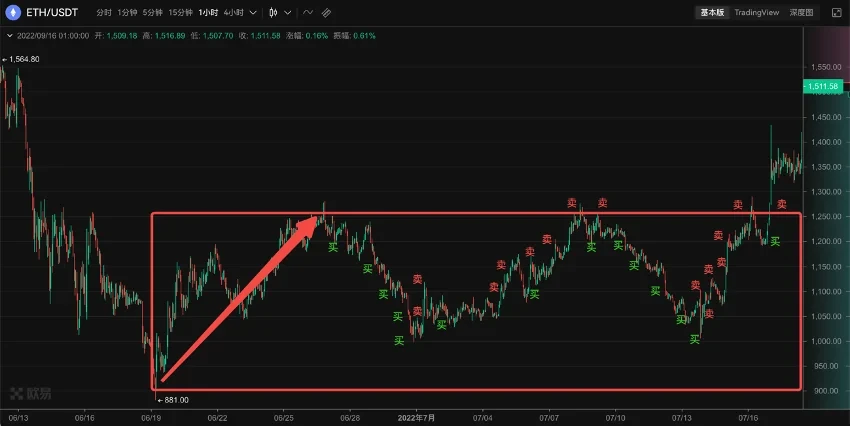
For example, ETH hit a low of $881 on June 19 this year, then rebounded strongly, reaching around $1,280 on June 26. This sharp rebound after consecutive drops may indicate that short-term price action could enter a consolidation phase. This is when the spot grid strategy can be deployed.
You can set the grid's upper and lower price limits around the high and low of this rebound, for example, $900–$1,250. With the default equal-division lines as grid lines, you can see that if a grid strategy was created on June 26, by around July 18 when the price broke above the grid's highest price, this strategy would have captured two rounds of gains from $1,000–$1,250 during those three weeks of consolidation — quite substantial returns.
4. How to Use Spot Grid (Smart / Manual Mode)
Accessing Spot Grid:
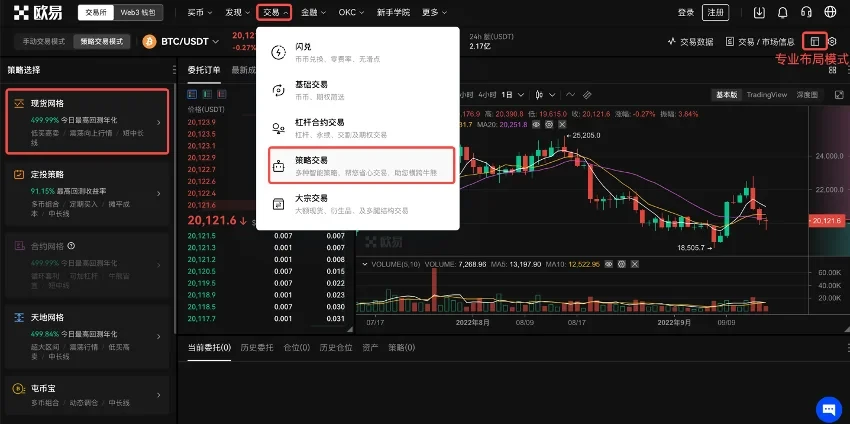
On Web, select 【Trading】-【Strategic Trading】, and under 【Pro Layout Mode】, you can find 【Spot Grid】 in the strategy selection list on the left side of the page.
On the APP, you can access the 【Spot Grid】 page through 【Trading】-【Spot】-【Strategies】.
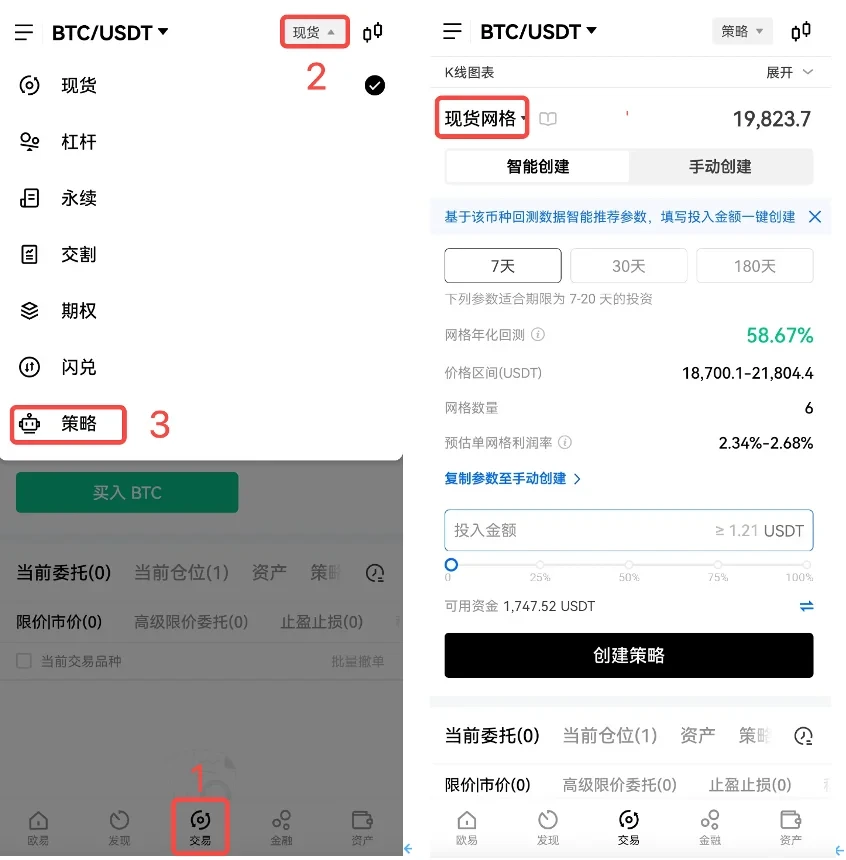
Spot Grid offers two modes: 【Smart Creation】 and 【Manual Creation】:
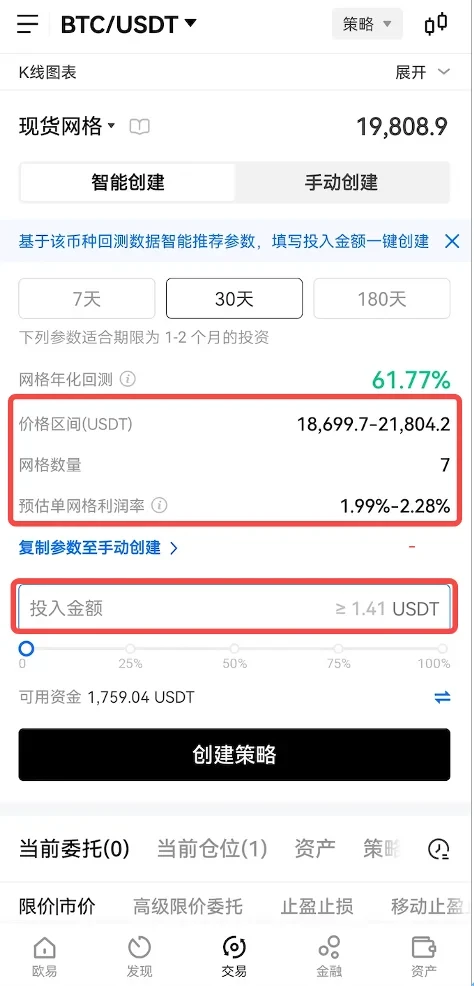
Smart Creation: The system backtests historical market data for that trading pair and provides recommended strategy parameters. While not a guarantee of actual returns, these are relatively optimized parameters derived from the system's continuous backtesting — useful as a reference for users.
The grid parameters are pre-configured by the system. Users only need to enter the 【Investment Amount】 to create the strategy. This mode is ideal for beginners.
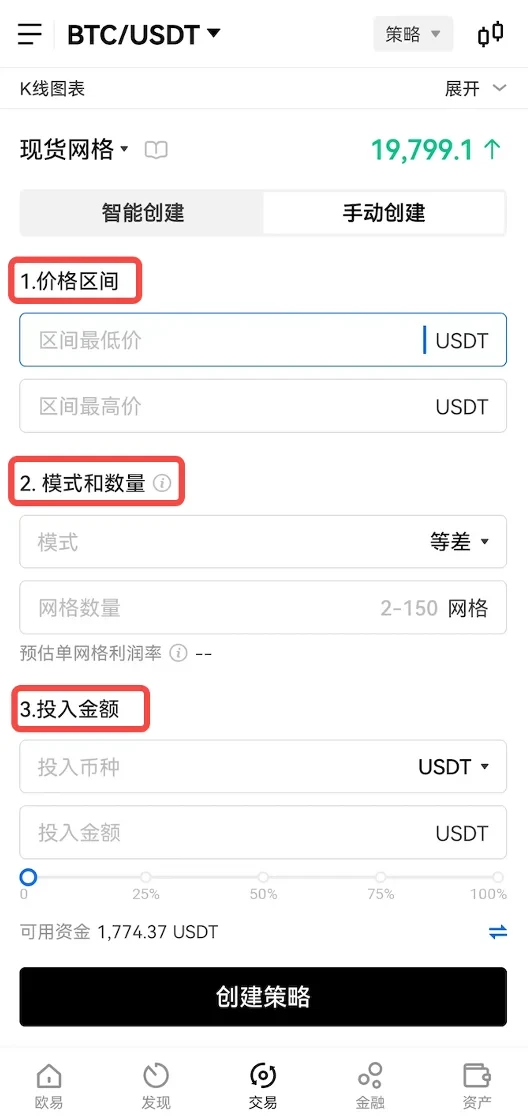
Manual Creation: This mode places higher demands on users, requiring a solid foundation in trading. Users set strategy parameters based on their analysis of the consolidation range, including the 【Price Range】 high/low prices; the grid's 【Mode and Number】; and the 【Investment Amount】 type and size, before creating the strategy. This mode requires users to independently determine the market highs and lows — i.e., the grid's highest and lowest prices — as well as the number of grids and investment amount, demanding a relatively high level of trading expertise.
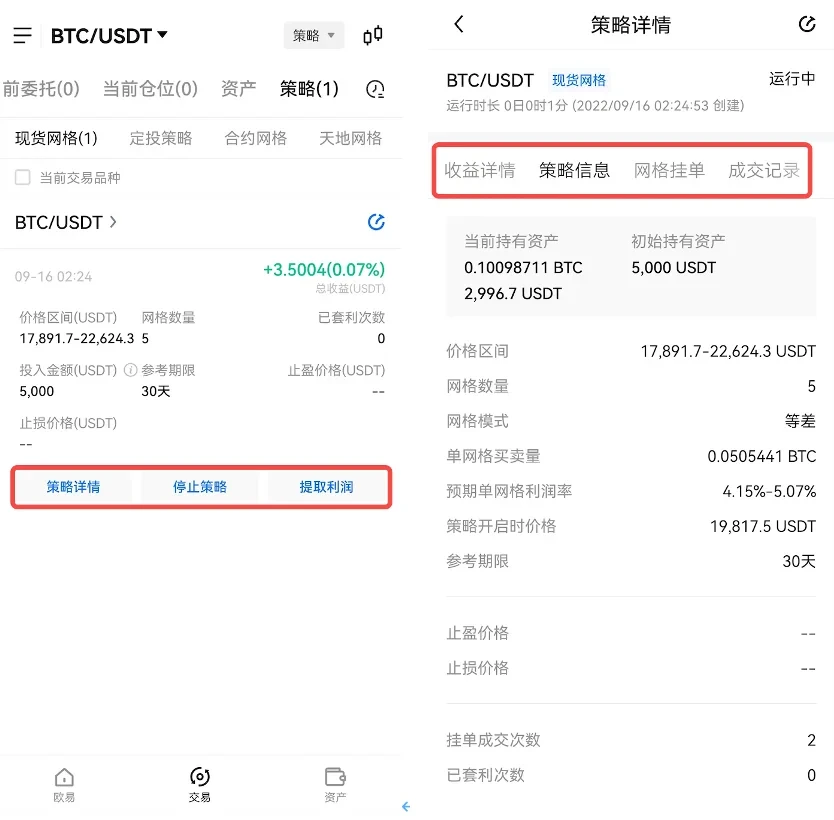
Taking 【Smart Creation】 of BTC/USDT trading as an example, once a strategy is created, it can be viewed under 【Strategies】 at the bottom of the page, along with 【Strategy Details】, 【Stop Strategy】, and 【Withdraw Profits】. Strategy Details allows you to view return performance, strategy information, pending orders, and fill records — quite comprehensive. For newcomers, simply wait for the strategy to execute automatically, without the hassle of constantly monitoring the market.
5. Key Considerations for Spot Grid
1. Spot grid is not a one-size-fits-all strategy — it is only suitable for consolidation markets. Once a one-sided trend emerges, such as a sustained rally that breaks above the grid's upper limit, you will miss out on subsequent gains; or if there is a sustained decline that drops below the grid's lower limit, you risk being fully invested and trapped. When the price exits the grid range, the strategy will automatically stop. Therefore, it is recommended to set take-profit and stop-loss orders simultaneously when creating a strategy.
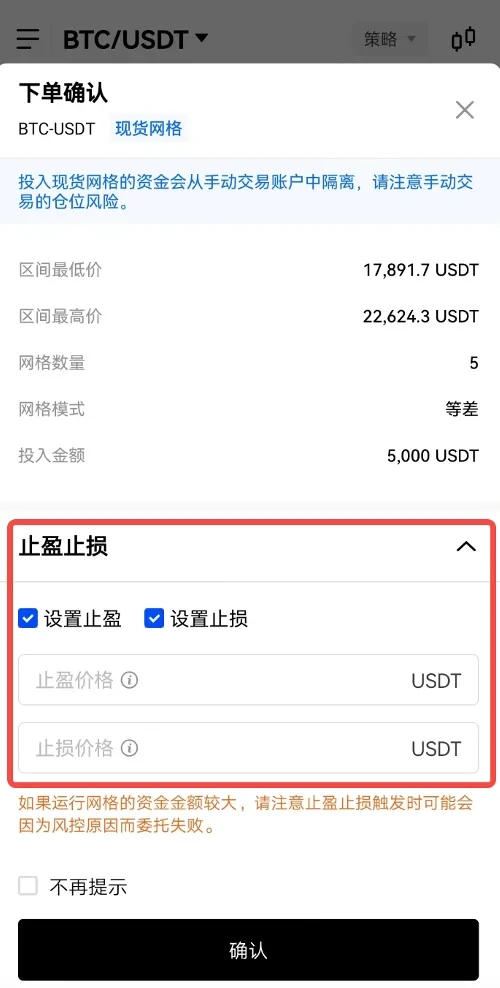
Take-profit/Stop-loss: When the latest price rises above the take-profit price, or the latest price falls below the stop-loss price, the grid strategy stops. The system automatically sells the underlying asset and returns all funds to the Manual Trading - Cross Margin account.
2. Once a grid is created, the invested funds are isolated from the trading account and used exclusively within the grid strategy. Therefore, users should monitor the risk this fund transfer poses to overall positions in the trading account.
3. When the take-profit/stop-loss is triggered to stop the strategy, or when manually stopping, there will be a market sell order to dispose of the traded currency. If the risk control system determines this may pose a risk to the market, the sell order may fail, and users should independently decide whether to proceed with a manual sell.
4. If the trading pair encounters unforeseen circumstances such as trading halts or delisting during the grid strategy operation, the grid strategy will automatically stop.
Key Takeaways from This Article:
Disclaimer
This article may contain product-related information that does not apply to your region. This article is intended to provide general information only and makes no responsibility for any factual errors or omissions contained herein. The views expressed in this article are solely those of the author and do not represent the views of OKX. This article is not intended to provide any advice, including but not limited to: (i) investment advice or investment recommendations; (ii) offers or solicitations to buy, sell, or hold digital assets; or (iii) financial, accounting, legal, or tax advice. Holding digital assets (including stablecoins) involves a high level of risk and may be subject to significant price fluctuations, and may even become worthless. You should carefully consider whether trading or holding digital assets is appropriate for you based on your financial situation. For questions specific to your circumstances, please consult your legal/tax/investment professional. The information contained in this article (including market data and statistics, where applicable) is provided for general reference purposes only. Although all reasonable precautions have been taken in preparing such data and charts, we assume no responsibility for any factual errors or omissions expressed herein. © 2025 OKX. This article may be reproduced or distributed in its entirety, or excerpts of 100 words or less may be used, provided that such use is non-commercial in nature. Any reproduction or distribution of the full article must prominently state: "This article is copyrighted © 2025 OKX, used under permission." Permitted excerpts must cite the article name and include the source, for example: "Article name, [author name (if applicable)], © 2025 OKX." Some content may have been generated or assisted by AI tools. Derivative works and other uses of this article are not permitted.
Show More
Recommended Reading

Can You Profit Even When Bitcoin Falls? How to Trade Futures Contracts
As the cryptocurrency market represented by Bitcoin continues to expand, diverse forms of derivatives trading have gradually emerged alongside spot trading, serving as hedging tools. Among these, futures trading has garnered the most attention. What is futures trading? Futures contracts are the most common form of trading contract in the digital assets derivatives market. Digital assets futures trading refers to buyers and sellers agreeing to trade a specific asset at a predetermined price at a future date.
January 16, 2026
Even Simpler Than Copy Trading? Follow Top Traders with One Click on OKX and Let Them Earn for You
Whether in traditional finance or the cryptocurrency market, strategic trading is a vital and crucial component of the trading system. When faced with complex trading environments and extreme market conditions, even with solid theoretical knowledge and extensive trading experience, it is easy to miss trading opportunities or make incorrect decisions influenced by emotions. Strategic trading is precisely an effective tool to address these challenges. Now that you have the trading tools, how do you
November 21, 2025

5. Strategic Trading Series — Savings Plan
Foreword: We often have such speculation: In a bull market, there are many digital assets that surge dramatically. If we could continuously capture assets with large gains — for example, catching one that doubles every month — your assets would multiply by 2 to the power of 12, or 4,096 times, by the end of the year. That is truly staggering, but it is also practically impossible, as it is difficult to continuously catch assets that surge dramatically. This is a common issue many users face: In a bull market, although
November 3, 2025

Which Countries/Regions Do Not Support Registration on OKX
OKX currently does not provide services to customers from the following regions: certain U.S. territories such as New York, Texas, Puerto Rico, American Samoa, Guam, the Commonwealth of the Northern Mariana Islands, the U.S. Virgin Islands (St. Croix, St. John, and St. Thomas), Cuba, Iran, North Korea, Crimea, Malaysia, Syria, Bangladesh, and Bolivia. For details, please refer to the OKX Terms of Service.
April 25, 2024
Quick Guide to OKX Products and Features
OKX (www.okx.com) is one of the world's renowned digital assets service platforms, primarily offering global users Bitcoin, Ethereum, and other digital assets spot and derivatives trading services, while also exploring the worlds of DeFi, dApps, NFTs, and GameFi alongside its users. On OKX, you can enjoy seamless spot and futures trading experiences, stay updated on tokens in trending sectors/concepts first, and much more.
April 25, 2024

Learn Candlestick Patterns from Zero — Part 5 | Importance of Candlestick Pattern Application
Trends exist in price movements; understand the language of prices. Signals exist for buying and selling; goodbye to gut-feeling trading. Part 1: Bullish Candlestick Patterns at Key Levels In the previous two installments of this chapter, we covered bullish and bearish candlestick pattern applications, but these patterns are not effective in every situation. In this section, we will discuss the importance of where these patterns appear. Where can bullish patterns work best? The first scenario: Near the end of a clear uptrend
April 25, 2024