Grid Strategy Adds Trigger Conditions to Precisely Capture Every Investment Opportunity
In trading markets, whether in bull or bear markets, unilateral trends are relatively rare. Most of the time, asset prices fluctuate within a certain range, commonly known as a sideways or oscillating market. In such market conditions, profiting through grid operations is a very common trading strategy—centering around a benchmark price within a specific range, using price fluctuations to execute staged buy-low-sell-high operations to earn spread returns.
Simply put, grid trading is a programmatic behavior that can achieve better trading results with the help of automated trading tools. Recently, OKX has introduced grid strategy trading modes for both spot and futures markets. Through the creation of strategy models, trading strategies are automatically executed for programmatic trading and order placement, saving time spent watching the market while not missing market opportunities.
Recently, to enhance user experience and enrich strategy model creation options, OKX has upgraded its spot/futures grid strategies with new trigger conditions including price triggers, meeting the trading needs of different users under various market conditions and facilitating the execution of personalized trading strategies.
New Trigger Conditions Broaden Strategy Boundaries
Building upon the original immediate trigger, this grid strategy upgrade adds two new trigger types: price trigger and RSI technical indicator trigger:
Price Trigger
Is the current market price not within your ideal grid range? Creating a grid now wouldn't align with your trading strategy, but waiting to create it later risks missing market opportunities?
By setting price trigger conditions in advance to complete grid strategy model creation, the grid strategy can automatically start running when the market price reaches the ideal trigger price. This increases flexibility in grid creation and broadens the boundaries of strategy execution, enabling more personalized implementation of various strategic trading ideas.
RSI Technical Indicator Trigger
In addition to the new price trigger, this upgrade also introduces a trigger type based on the RSI technical indicator.
RSI (Relative Strength Index) is one of the most widely used technical analysis indicators in trading markets. Based on supply and demand principles, it evaluates the relative strength of bullish and bearish forces to provide guidance for subsequent operations, encompassing judgment principles related to values, crossovers, patterns, divergences, and more. You can view "Learning K-Line from Scratch | 24 Common Analysis Indicators 6—RSI" to learn about this indicator and its applications.
The newly added RSI technical indicator trigger uses numerical values for buy/sell judgments. Traders can select different candlestick periods based on their strategy timeframe, set RSI trigger conditions and values according to their bullish/bearish direction assessment, to complete the creation of grid strategies triggered by this technical indicator. The program will automatically start running once the RSI indicator reaches the set threshold. Specifically, this mainly includes the following three scenarios:
① Long Strategy (Spot Grid / Futures Long Grid): Long grids only open and close long positions, suitable for upward oscillating markets.
RSI indices typically use 30 as the oversold threshold, indicating the market is in a downtrend. When RSI values fall below the oversold threshold, it often represents that the short-term decline is ending and a trend reversal may be imminent—making it a good opportunity to go long. The threshold can be adjusted based on actual market conditions.
② Short Strategy (Futures Short Grid): Short grids only open and close short positions, suitable for downward oscillating markets.
RSI indices typically use 70 as the overbought threshold, indicating the market is currently in an overbought state. When RSI values exceed the overbought threshold, it often suggests that subsequent price action may experience a pullback or trend reversal—making it a good opportunity to go short. Short positions can also adjust thresholds based on actual market conditions.
③ Neutral Strategy (Futures Neutral Grid): Neutral grids open short/close short above the set price range and open long/close long below it.
The neutral strategy is neither bullish nor bearish, typically using the RSI index midpoint of 50 as a reference value. For example, when the RSI value crosses upward through 50, execute a sell/short operation; conversely, execute a buy/long operation.
How to Set Trigger Conditions to Create Grid Strategies
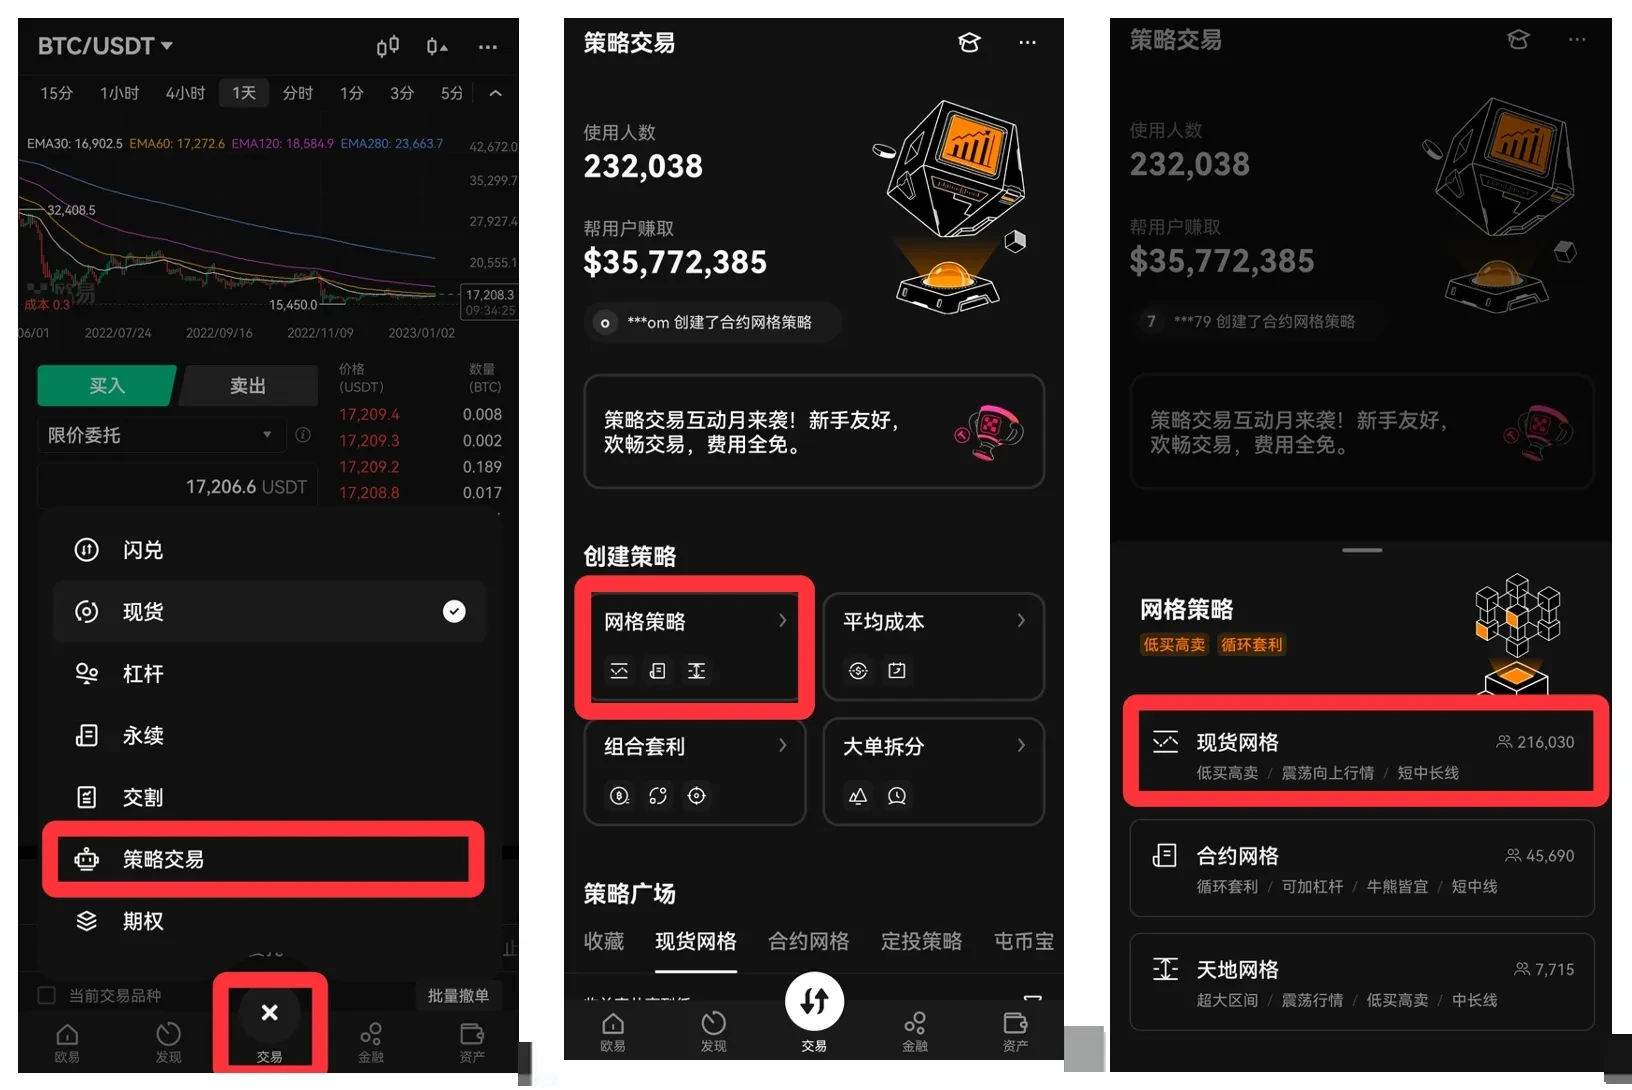
1) Click [Trade] - [Strategies] to enter the OKX strategies page, select [Spot Grid] / [Futures Grid]. Here we use spot grid as an example.
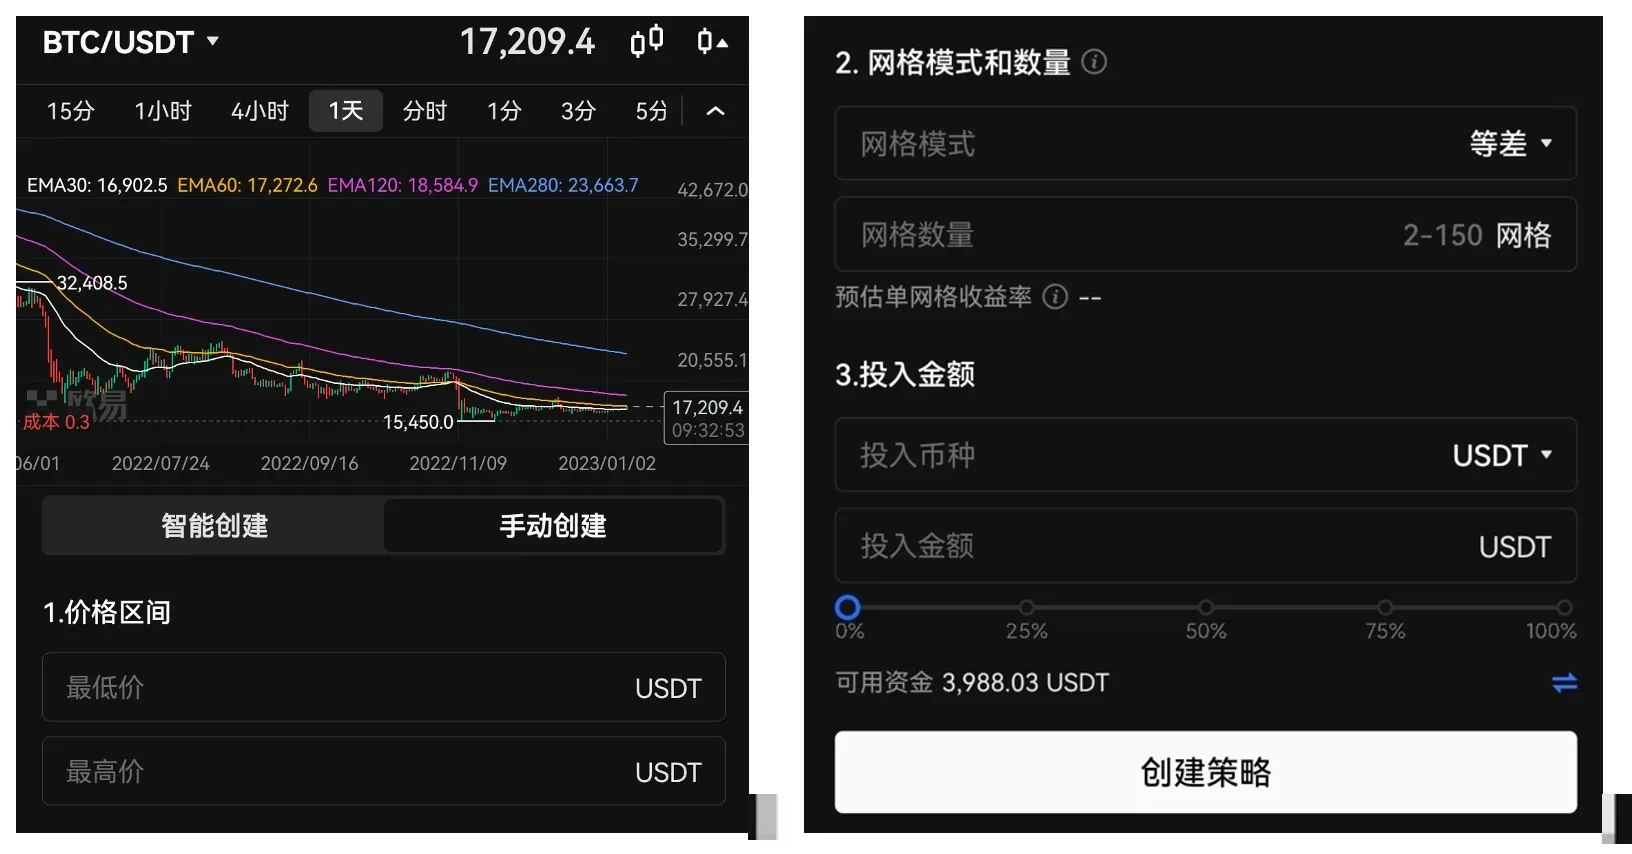
2) Set the basic parameters of the grid strategy, including price range, grid mode and quantity, margin investment amount, etc.
3) Set grid start and stop conditions in the [Advanced Settings] section
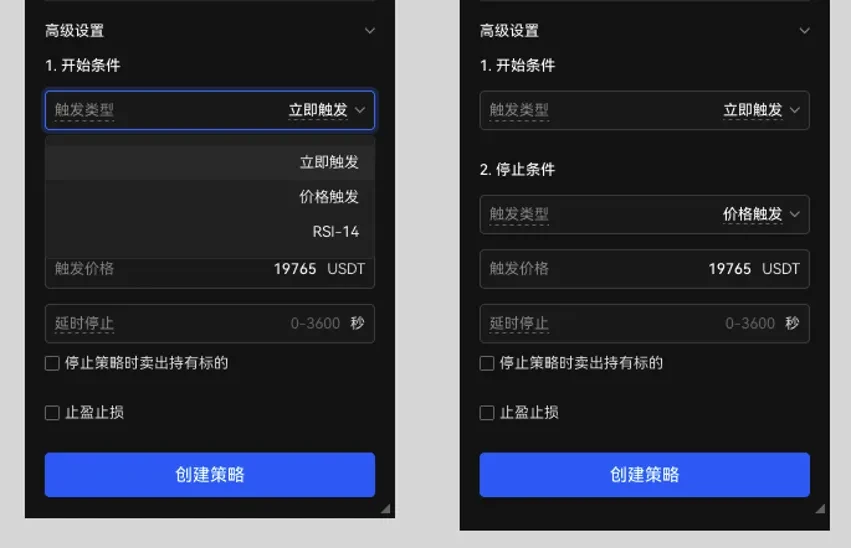
Trigger Condition 1: Immediate Trigger / Manual Stop (System Default Setting) Start Condition: Immediate Trigger—the strategy starts running immediately after creation; Stop Condition: Manual Stop—the strategy requires manual clicking to stop.
Trigger Condition 2: Price Trigger (Manual Setting Required) After selecting price trigger, enter the trigger price and set the delay time (integer within [0-3600]s). When the trigger price is set above the current market price, the grid strategy will trigger and start grid trading when the market price is greater than or equal to the trigger price; when the trigger price is set below the current market price, the grid strategy will trigger and start grid trading when the market price is less than or equal to the trigger price.
Trigger Condition 3: RSI - 14 (Manual Setting Required) After selecting RSI as the trigger type, the system provides default parameters:
- Spot Grid / Futures Grid-Long Strategy Trigger Value: 30 Candlestick Period: 3m Trigger Condition: Below
- Futures Grid-Short Strategy Trigger Value: 70 Candlestick Period: 3m Trigger Condition: Above
- Futures Grid-Neutral Strategy Trigger Value: 50 Candlestick Period: 3m Trigger Condition: Crosses
RSI parameters can also be adjusted based on actual conditions: Trigger Value: Enter integer (1-100) Candlestick Period: Dropdown can select 3m, 5m, 15m, 30m, 1H, 4H, 1D, 3D Trigger Condition: Dropdown can select Below, Above, Crosses, Crosses Down, Crosses Up RSI triggers can also set delay time to control the time interval between when the market price touches the preset price and when execution begins.
4) In the [Advanced Settings] section, you can also set take-profit/stop-loss conditions and more to enrich the strategy model
5) After confirming all parameter settings, you can create the strategy. After the strategy is created, you can view and manage grid strategies in [Strategies] at the bottom of the trading page. During strategy operation, you can withdraw returns generated from grid arbitrage at any time, or stop the grid.
Important Notes
1. After this spot/futures grid strategy upgrade, strategies that have been created but not yet started can be manually started or stopped.
2. If the current price/indicator already triggers the stop condition when creating the strategy, the strategy creation will be unsuccessful and current settings need to be adjusted before recreating.
3. Regarding trigger condition parameter modifications: Price trigger conditions can have price parameters modified after strategy creation but before triggering; RSI trigger conditions do not allow parameter modifications. If you need to adjust parameters, you can stop the strategy and recreate it.
Disclaimer
This article may contain content related to products not available in your region. This article is dedicated to providing general information only and is not responsible for any factual errors or omissions. This article represents the author's personal views and does not represent OKX's views. This article is not intended to provide any of the following advice, including but not limited to: (i) investment advice or investment recommendations; (ii) offers or solicitations to buy, sell, or hold digital assets; or (iii) financial, accounting, legal, or tax advice. Holding digital assets (including stablecoins) involves high risk, may fluctuate significantly, or even become worthless. You should carefully consider whether trading or holding digital assets is suitable for you based on your financial situation. For questions regarding your specific situation, please consult your legal/tax/investment professionals. Information appearing in this article (including market data and statistics, if any) is for general reference purposes only. Although we have exercised all reasonable care in preparing this data and these charts, we assume no responsibility for any factual errors or omissions expressed herein. © 2025 OKX. This article may be copied or distributed in its entirety, and excerpts of 100 words or less may also be used, provided such use is non-commercial. Any copying or distribution of the entire article must also prominently state: "Copyright © 2025 OKX, used with permission." Permitted excerpts must cite the article title and include attribution, such as "Article Title, [Author Name (if applicable)], © 2025 OKX". Some content may be generated or assisted by artificial intelligence (AI) tools. Derivative works or other uses of this article are not permitted.
Show More
Recommended Reading
Can You Profit When Bitcoin Drops? How to Trade Futures
As the cryptocurrency market represented by Bitcoin continues to expand in scale, various forms of derivatives trading have gradually emerged beyond spot trading as a risk hedging tool, with futures trading being the most prominent. What is futures trading? Futures are the most common form of trading contract in the cryptocurrency derivatives market. Digital assets futures trading refers to buyers and sellers agreeing to trade a certain asset at a specified price at a future date.
January 16, 2026
Easier Than Copying Strategies? One-Click Copy the Best Strategy Traders on OKX and Let Them Make Money for You
Whether in traditional finance or cryptocurrency markets, strategy trading is a very important and crucial method in the trading system. When facing complex trading environments and extreme market conditions, even with solid theoretical technical knowledge and extensive trading experience, it's easy to miss trading opportunities or make incorrect judgments and operations due to emotional influences. Strategy trading is an effective tool to solve these problems. With the trading tools available, how do you use them
November 21, 2025

Five, Strategy Trading Series Courses—HODL Bot
Introduction: We often have this speculation: In a bull market, there are many digital assets that surge in price. If we could continuously capture assets with significant gains, such as catching a digital asset that doubles every month, after one year your assets would become 2 to the power of 12, or 4096 times—that's astonishing, though of course nearly impossible to achieve, because it's very difficult to continuously catch surging assets. This is also a problem many users encounter: in a bull market, although
November 3, 2025

Which Countries/Regions Do Not Support Registration for OKX
OKX currently does not provide services to customers in the following regions: Certain US territories, such as New York, Texas, Puerto Rico, American Samoa, Guam, Northern Mariana Islands, US Virgin Islands (St. Croix, St. John, and St. Thomas), Cuba, Iran, North Korea, Crimea, Malaysia, Syria, Bangladesh, and Bolivia. For details, please refer to the OKX Terms of Service.
April 25, 2024
Quick Guide to OKX Common Products and Features
OKX (www.okx.com) is one of the world's leading digital assets service platforms, primarily providing global users withBitcoin, Ethereum and other digital assets spot and derivatives trading services, while also exploring the worlds of DeFi, dApp, NFT and GameFi together with users. At OKX, you can enjoy smooth trading experiences for spot and futures, follow token information in trending sectors/concepts at the first opportunity, and also have
April 25, 2024

Learning K-Line from Scratch | 5 The Importance of Candlestick Pattern Application
Rises and falls have trends—understand price language; buying and selling have signals—say goodbye to intuitive trading. One, Bullish Candlestick Combinations at Key Positions In the previous two chapters of this section, we explained the application of bullish and bearish candlestick combinations, but these combinations are not effective when they appear at any position. In this section, we will explain the importance of where combinations appear. In which positions can bullish combinations better play their role? First scenario: In an obvious uptrend, near the previous
April 25, 2024